Week 7
This week was a busy one! I had finished extracting all the NuSTAR, Swift, and Chandra data, and we received all the
XMM-Newton extractions (except for the 2021 data) this week, so we were almost ready to start fitting data together.
Before that could happen, I had to extract the data from each telescope again three times. This time, each
extraction was limited by one of the three other observatory’s GTI. This left us with the data for 12 observatory
pairings for every year.
I spent a majority of the week updating an old program that my mentor had written so that it could read in and
analyze our new data. For each observatory pair for every year of observations, we needed to run a XSPEC script
that would fit the spectral data separately to create our confidence contours, then fit the data together to obtain
a ratio of the measured flux to the model flux for the flux ratio plot. Because there were so many observatory
pairs, I wrote a Python program that would take in the year and observatories and spit out the necessary XSPEC
script. In the end, I generated 78 XSPEC scripts, 12 for each of the 7 years studied minus 6 scripts in 2021
because of the missing XMM data that year. After that, all I had to do was run each XSPEC script, and we had
all the data needed to generate contour plots and flux ratio plots for every pairing for every year!
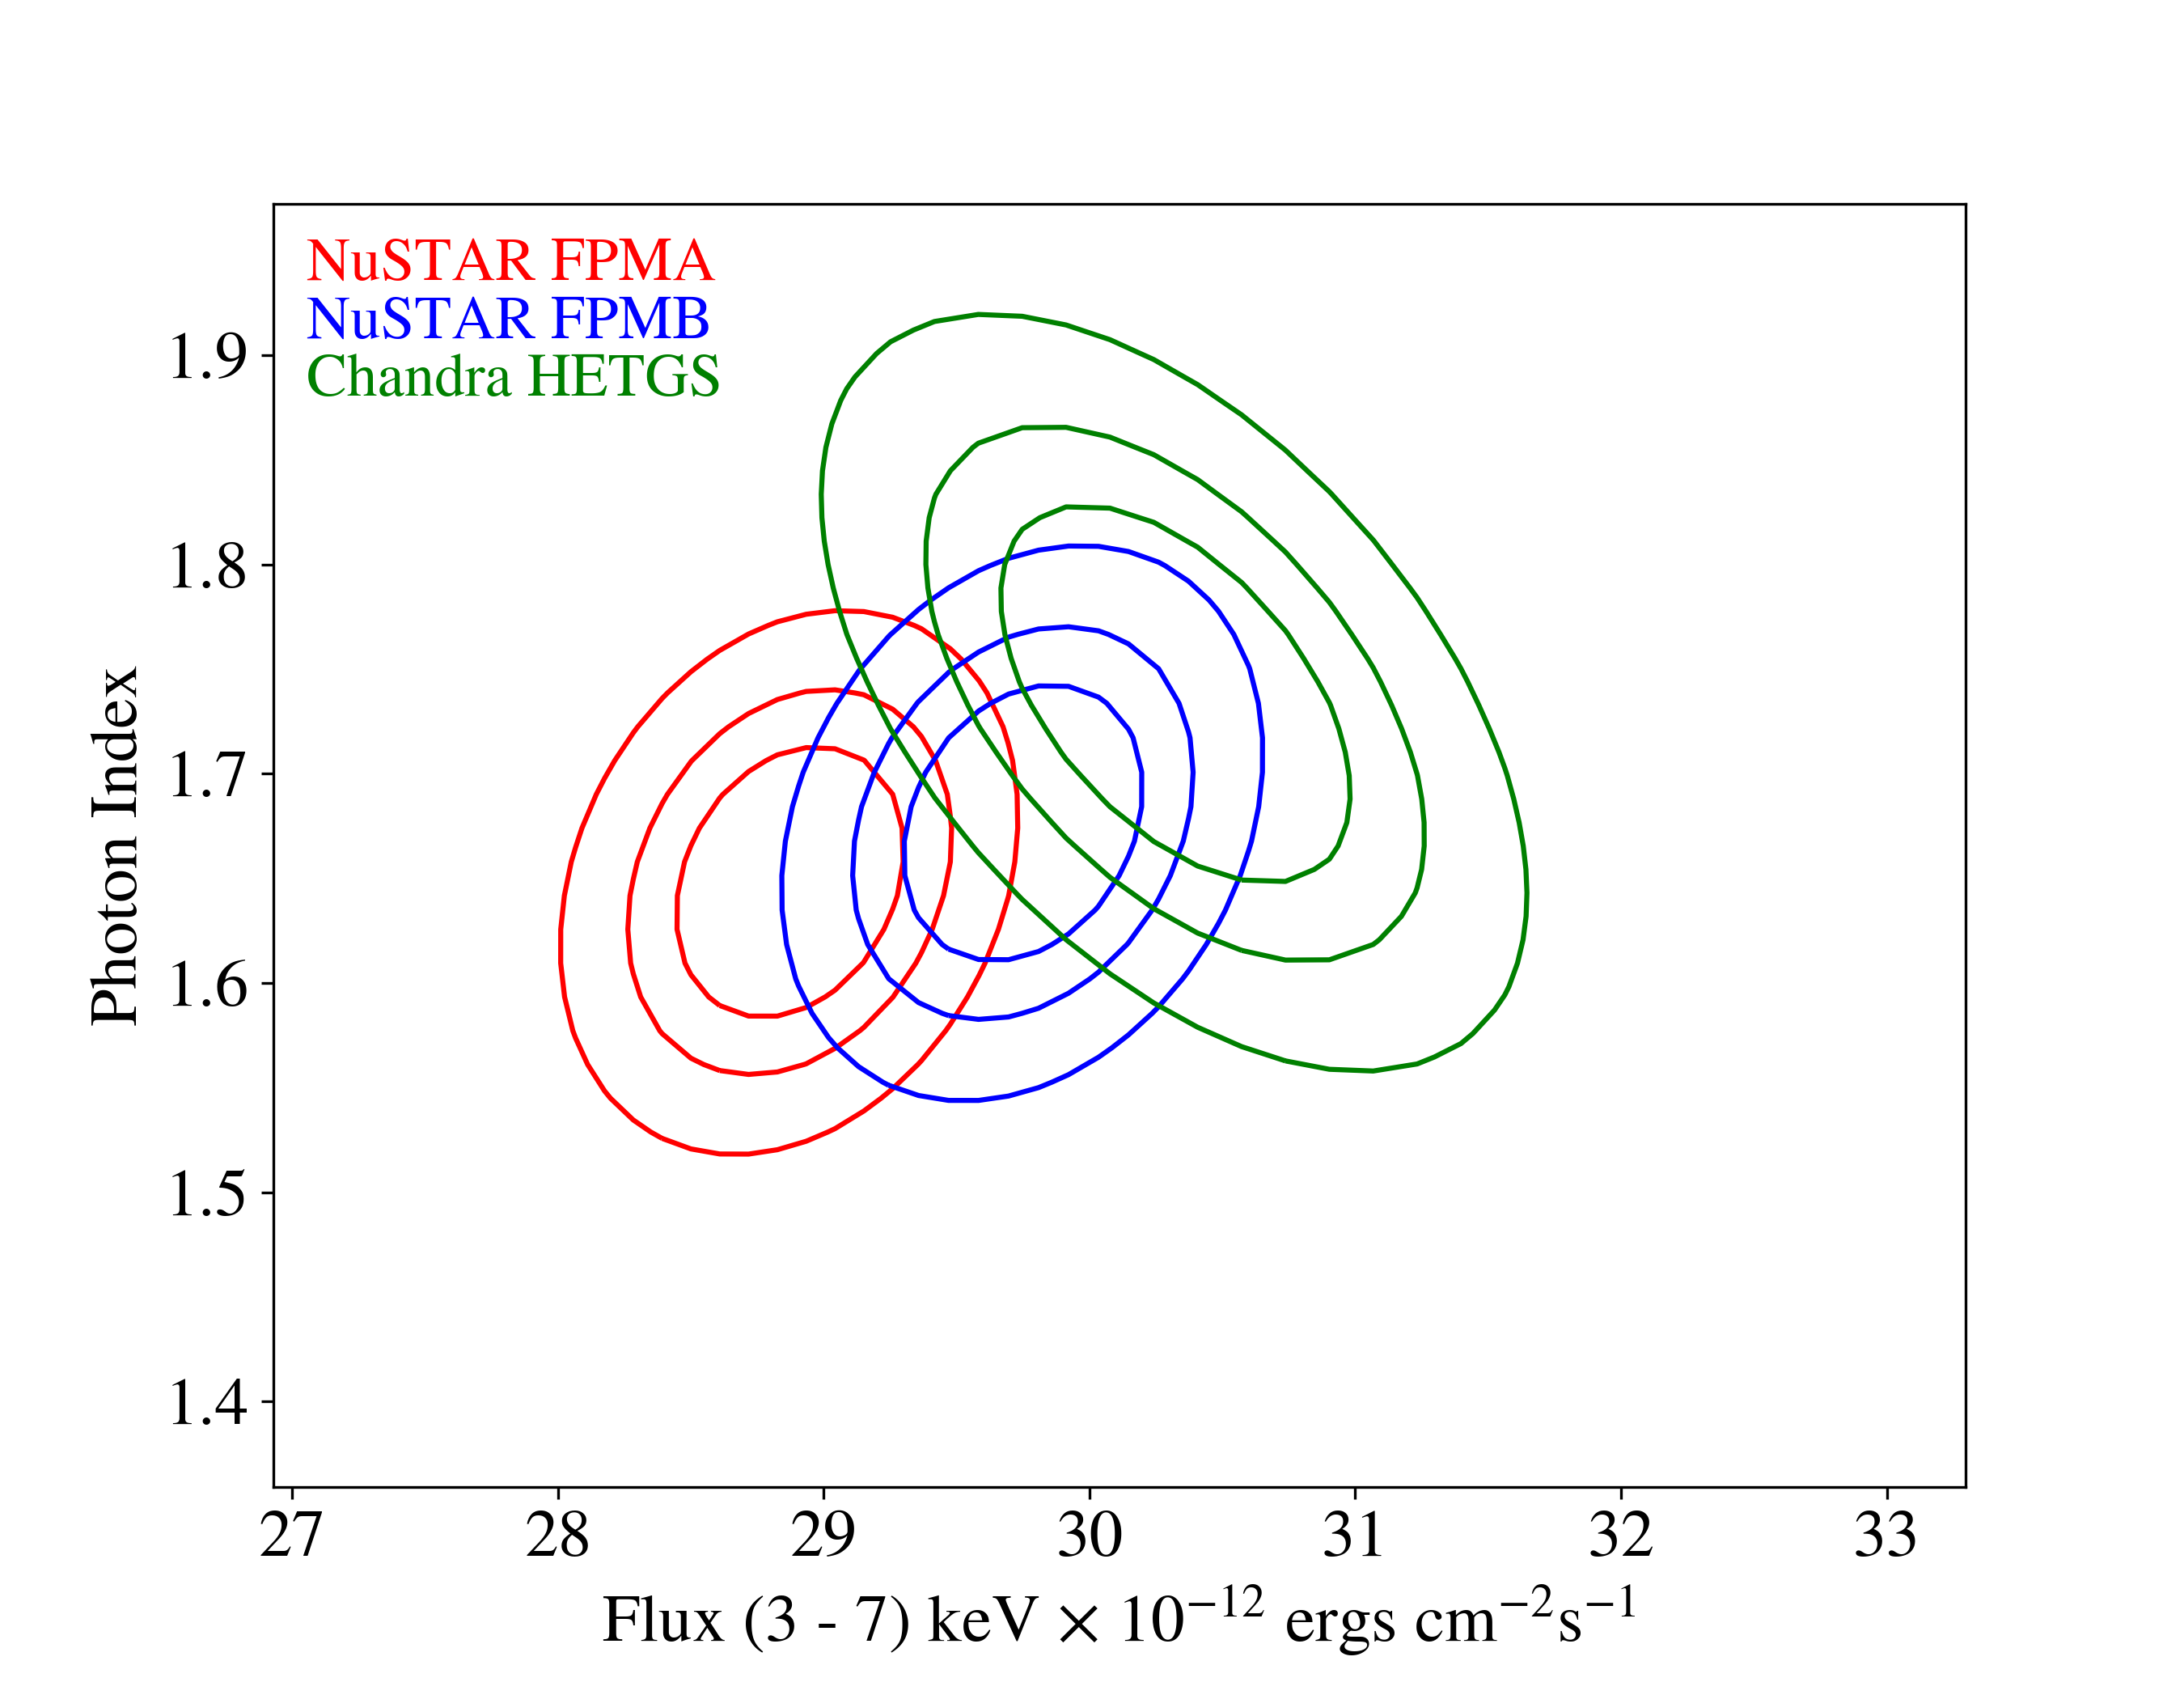
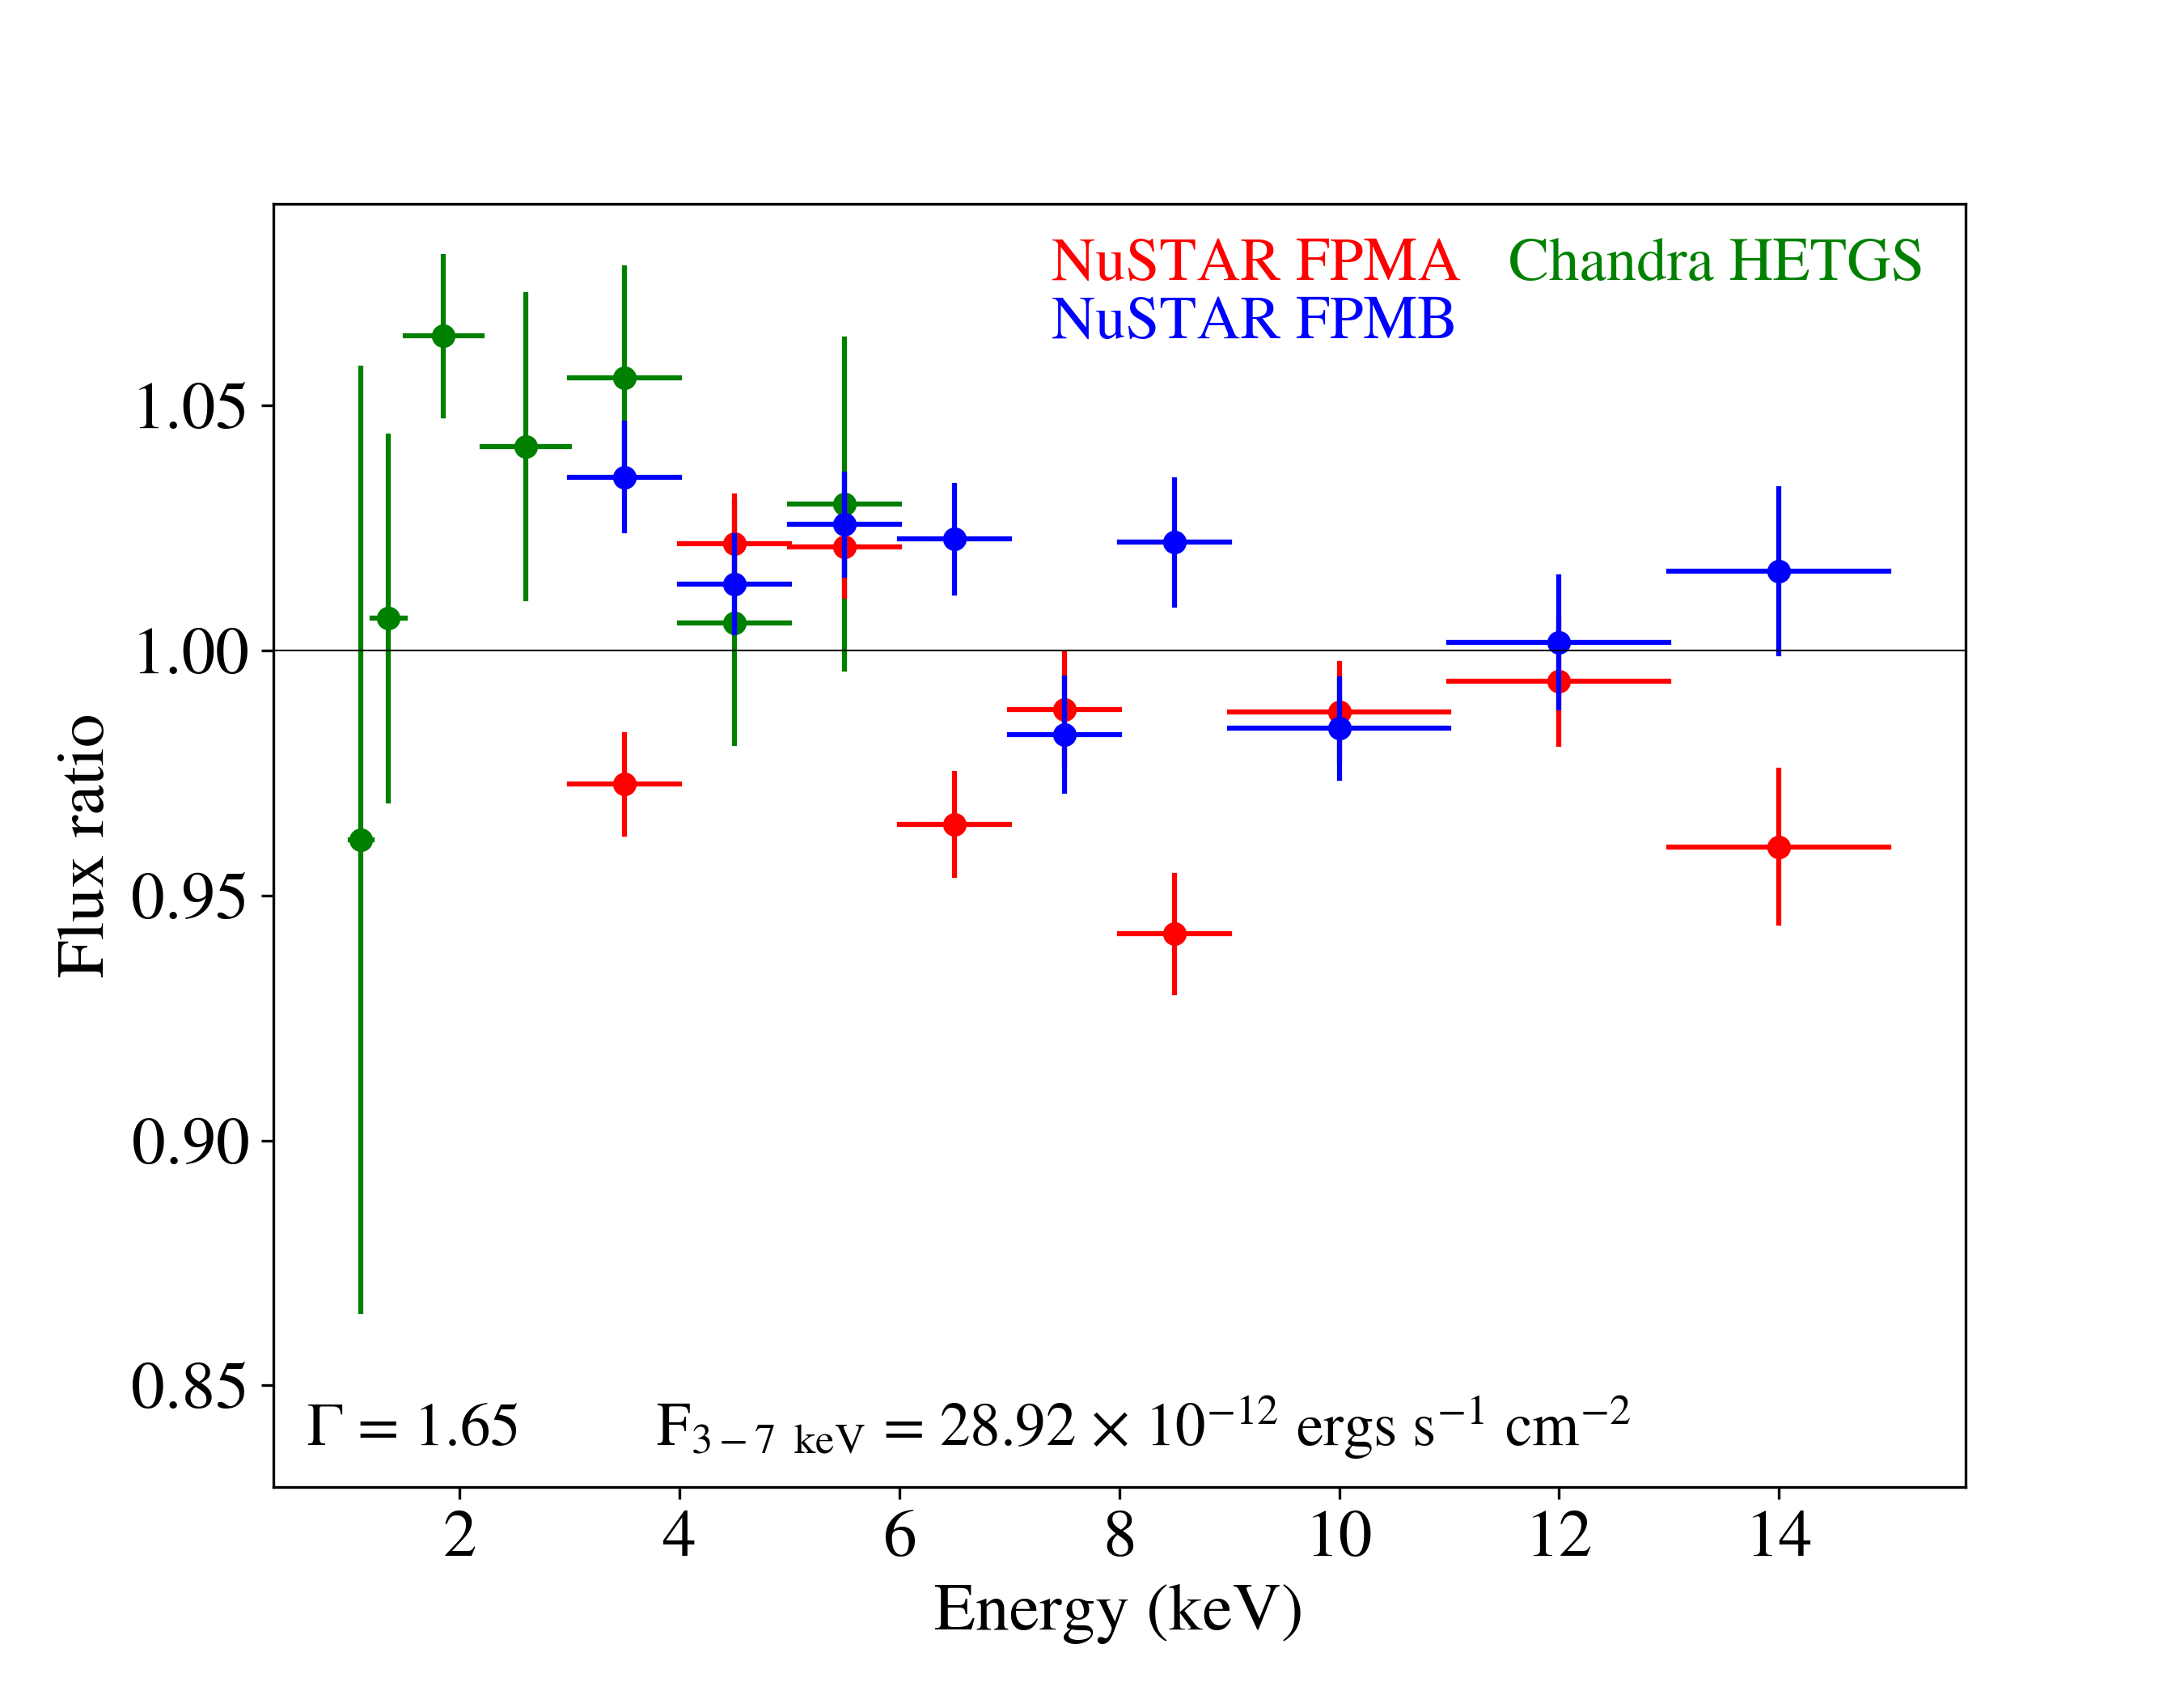
The final contour and flux plot for a random pairing. This is NuSTAR and Chandra in 2019.
Besides working on that, I went to a lot of events this week. I met with another NASA scientist and got to talk to him about grad school and his research. His is a leading expert in observational cosmology, which I’m interested in but don’t know much about, so it was great to learn more about it from an expert!I also went to a graduate school event where physics and astrophysics professors from different universities came to talk on a panel about graduate school application advice. It was incredibly helpful because, after the session, we got to speak with the panel members in breakout rooms, and I really connected with one of the professors I met with! Along with my research, the best part of this internship has definitely been getting to talk with and learn from these amazing people and get a better sense of my own direction in life!
Flyer for the graduate school panel.