Week 2
This week, I finally finished setting up my computer! I got all the software downloaded and installed
so that HEASoft could run properly, and I was able to begin looking at data. To make sure that all that
software worked, I walked through the
NuSTAR quickstart guide,
which explains how to analyze data from the NuSTAR telescope using a 2012 observation of 3C 273 as an example. I got
to play around with the images that the software produced, and it ended up making some pretty awesome figures!
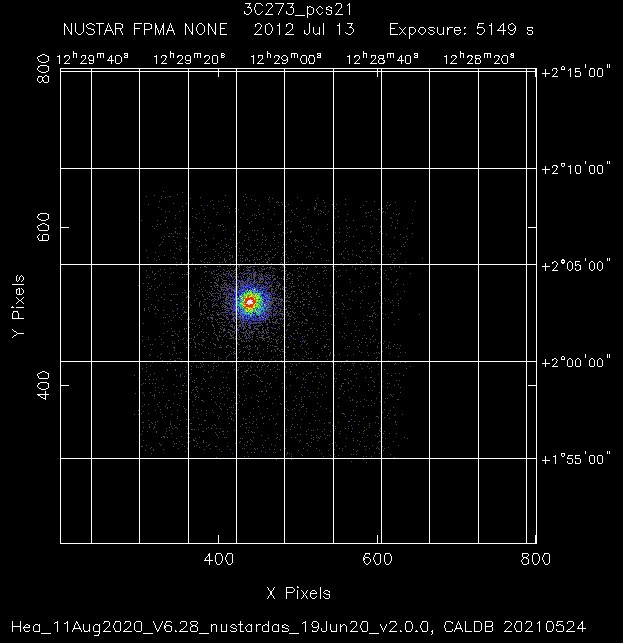
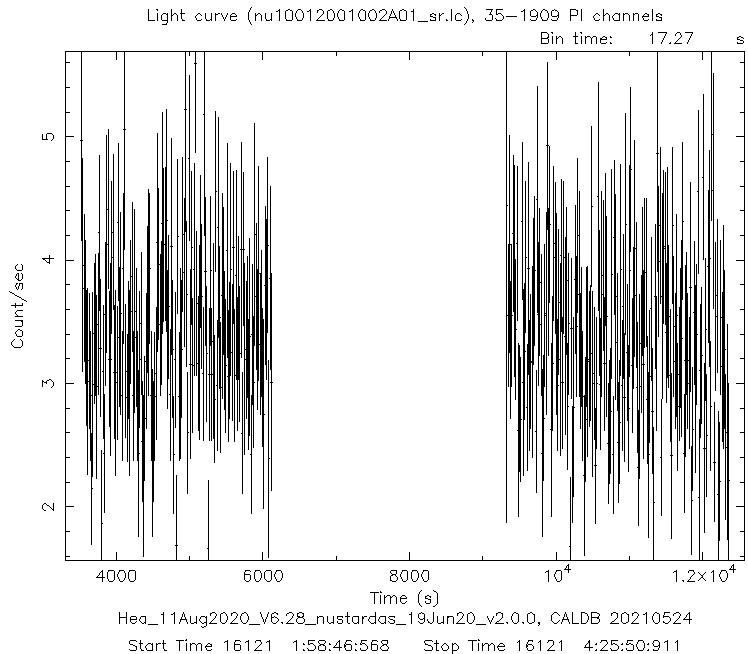
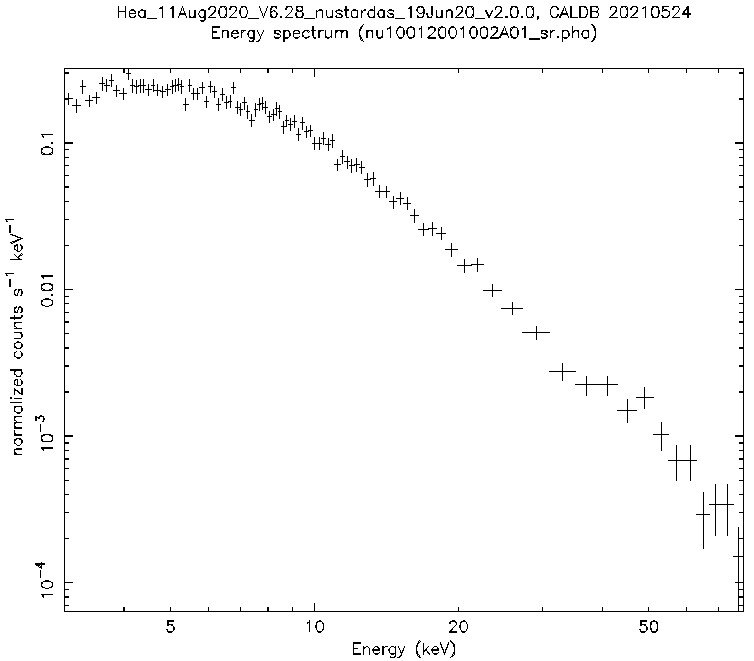
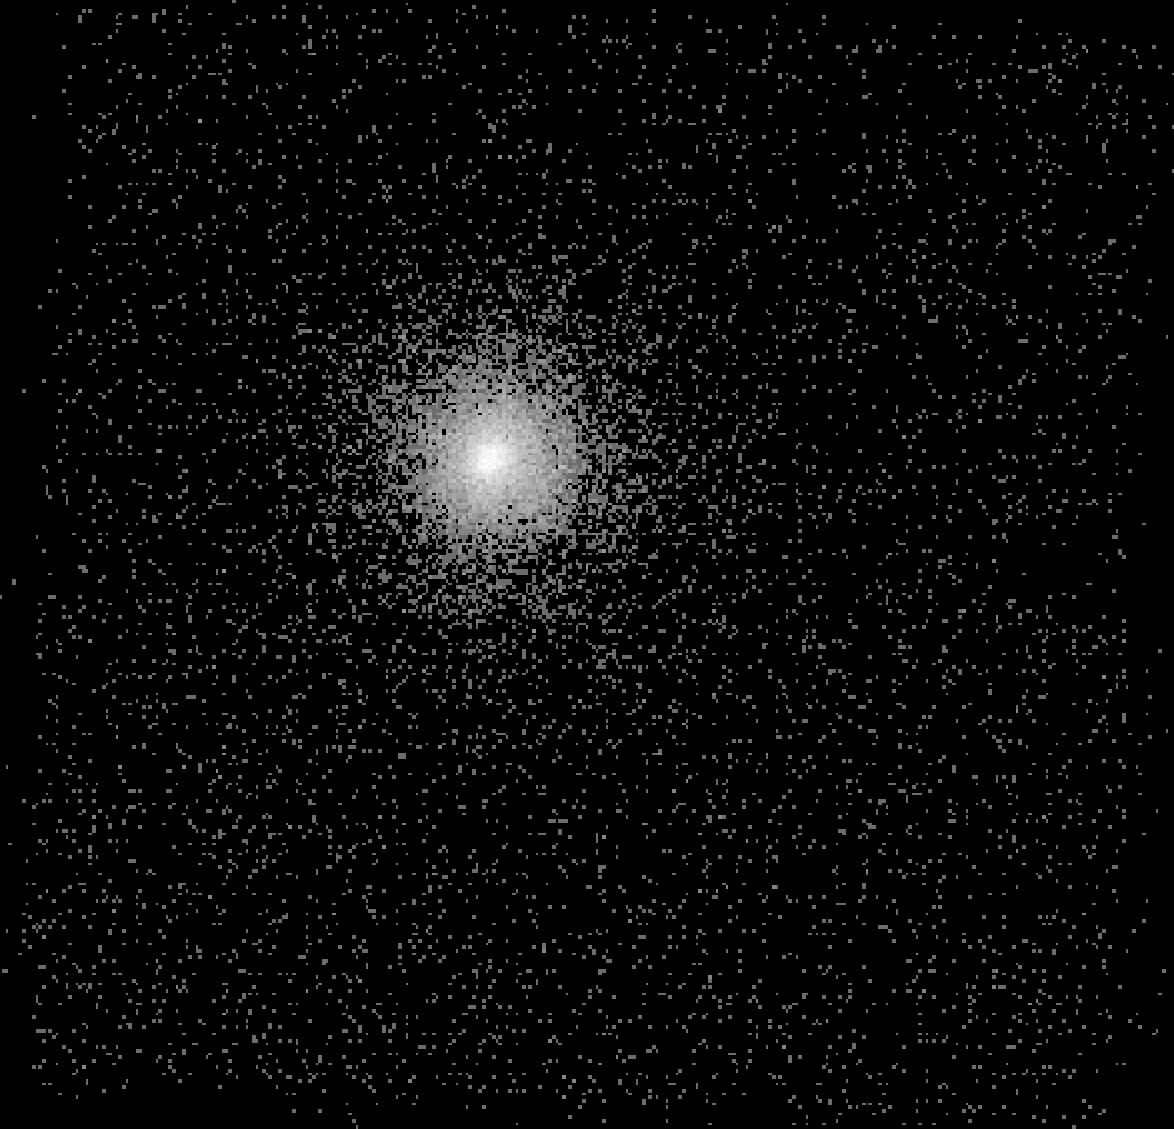
Figures produced through NuSTAR data analysis: Top left - Sky image; Top right - Source light curve (gap is where NuSTAR orbits behind Earth); Bottom left - Source energy spectrum; Bottom right - Event image (locations of X-ray events).
After I was finished with the quickstart guide, my mentor walked me through fitting a model to the energy curve that the data produced using XSPEC. It involved a lot of statistical analysis that I don’t fully understand, but I’m excited to learn more about that throughout the summer!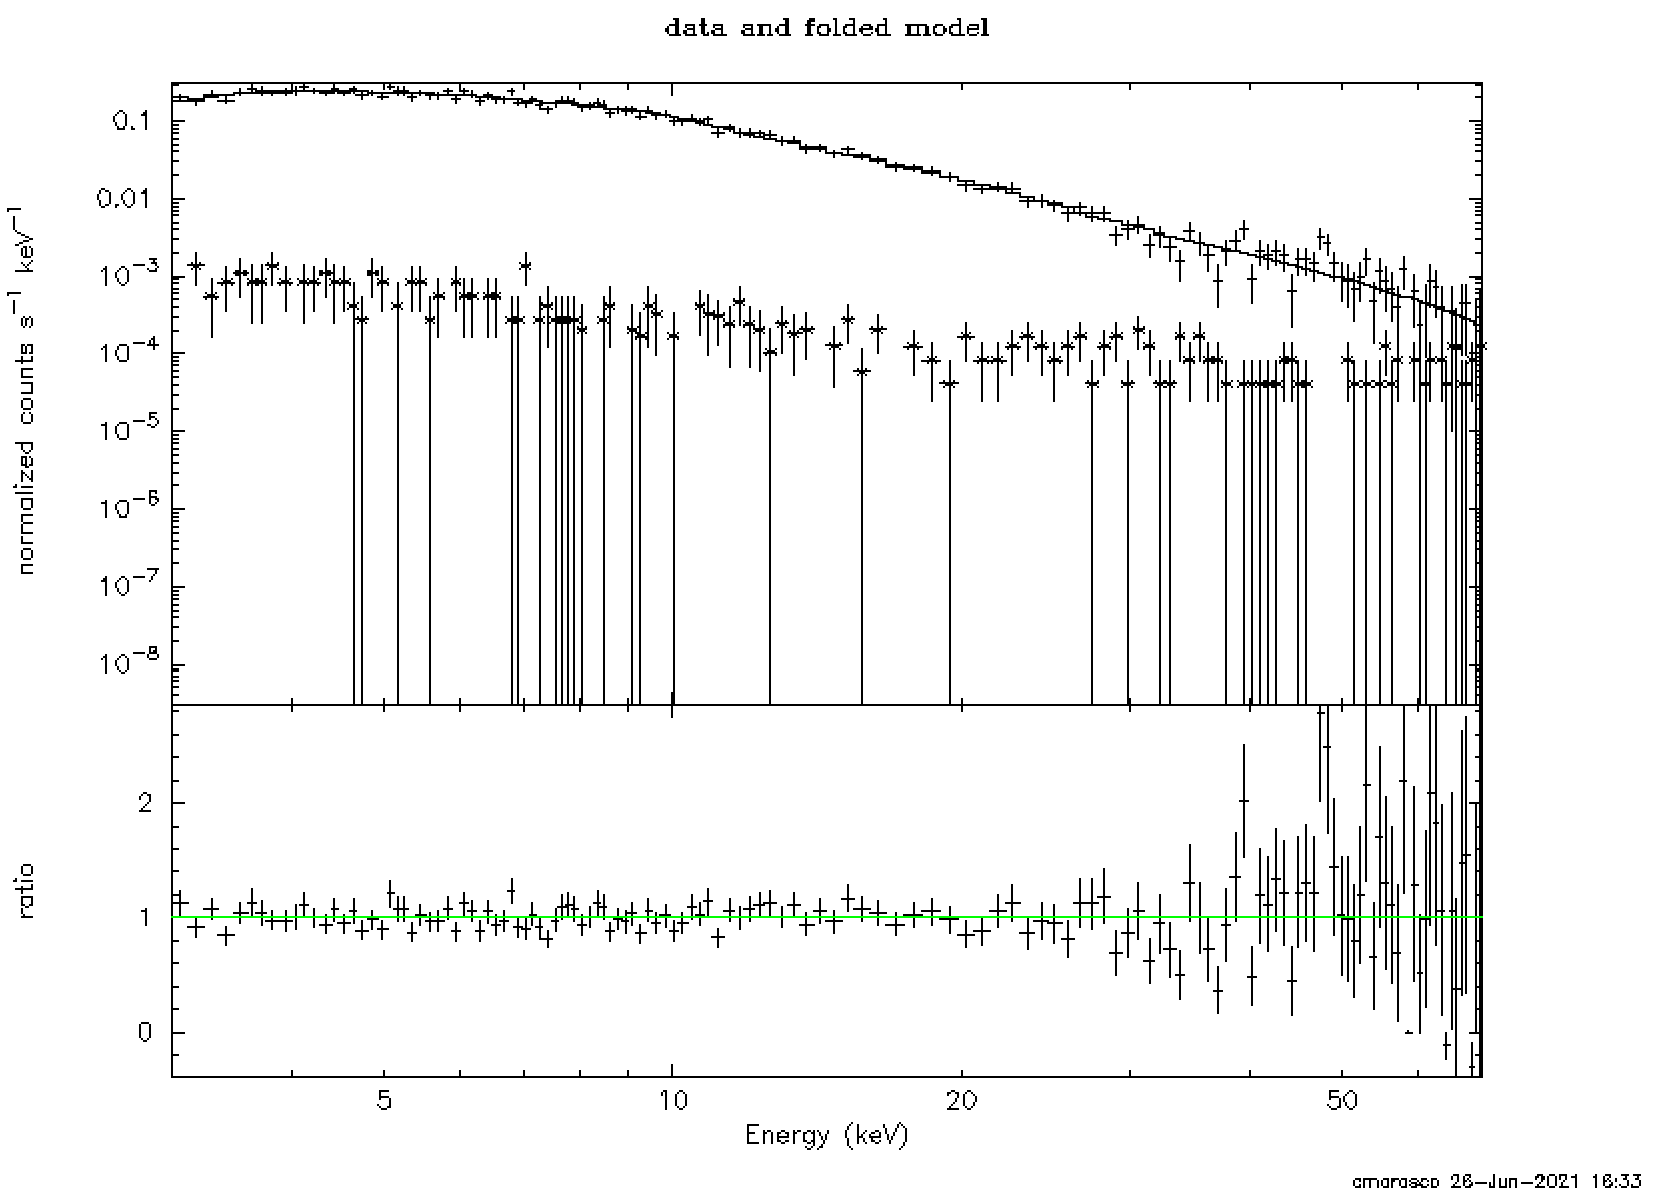
Fitted model to the source's energy spectrum.
Outside of work, I also attended some discussions/activities and began meeting other scientists at NASA. Right now,
there’s lots of activities for pride month, and it’s been amazing to see that there are so many other queer people
working at NASA! Everyone that I’ve talked to so far has been incredibly nice and I love learning more about the
amazing research that everyone’s working on. I didn’t expect the culture at NASA to be focused on diversity and
inclusion much at all, but I’m glad that so many people there are accepting and working to make the field better
for everyone!