Week 4
We started extracting the telescope data this week, which has been really cool! First, we had to send the GTI files
that I made last week to scientists who were familiar with the Chandra, Swift, and XMM-Newton telescopes so that they
could extract the data from their respective telescopes. Unfortunately, I didn’t realize that I had messed up the GTI
files until after I sent them out! I realized it pretty quickly though, so it ended up not being a big deal, which was
a huge relief.
Because my mentor is an expert on the NuSTAR telescope, she’s helping me extract that data myself. I spent most of the
week using the GTI files to extract lightcurves from the NuSTAR data. My mentor also showed me (again but in more
detail) how to fit a model to the NuSTAR data using XSPEC and how to save that data so it can be recreated in Python.
She also showed me how to create confidence contour plots from the lightcurve data to find a relationship between the
photon index and flux in the NuSTAR observations of the quasar 3C 273. I also learned how to save the contour plots so
that I can later recreate them in Python.
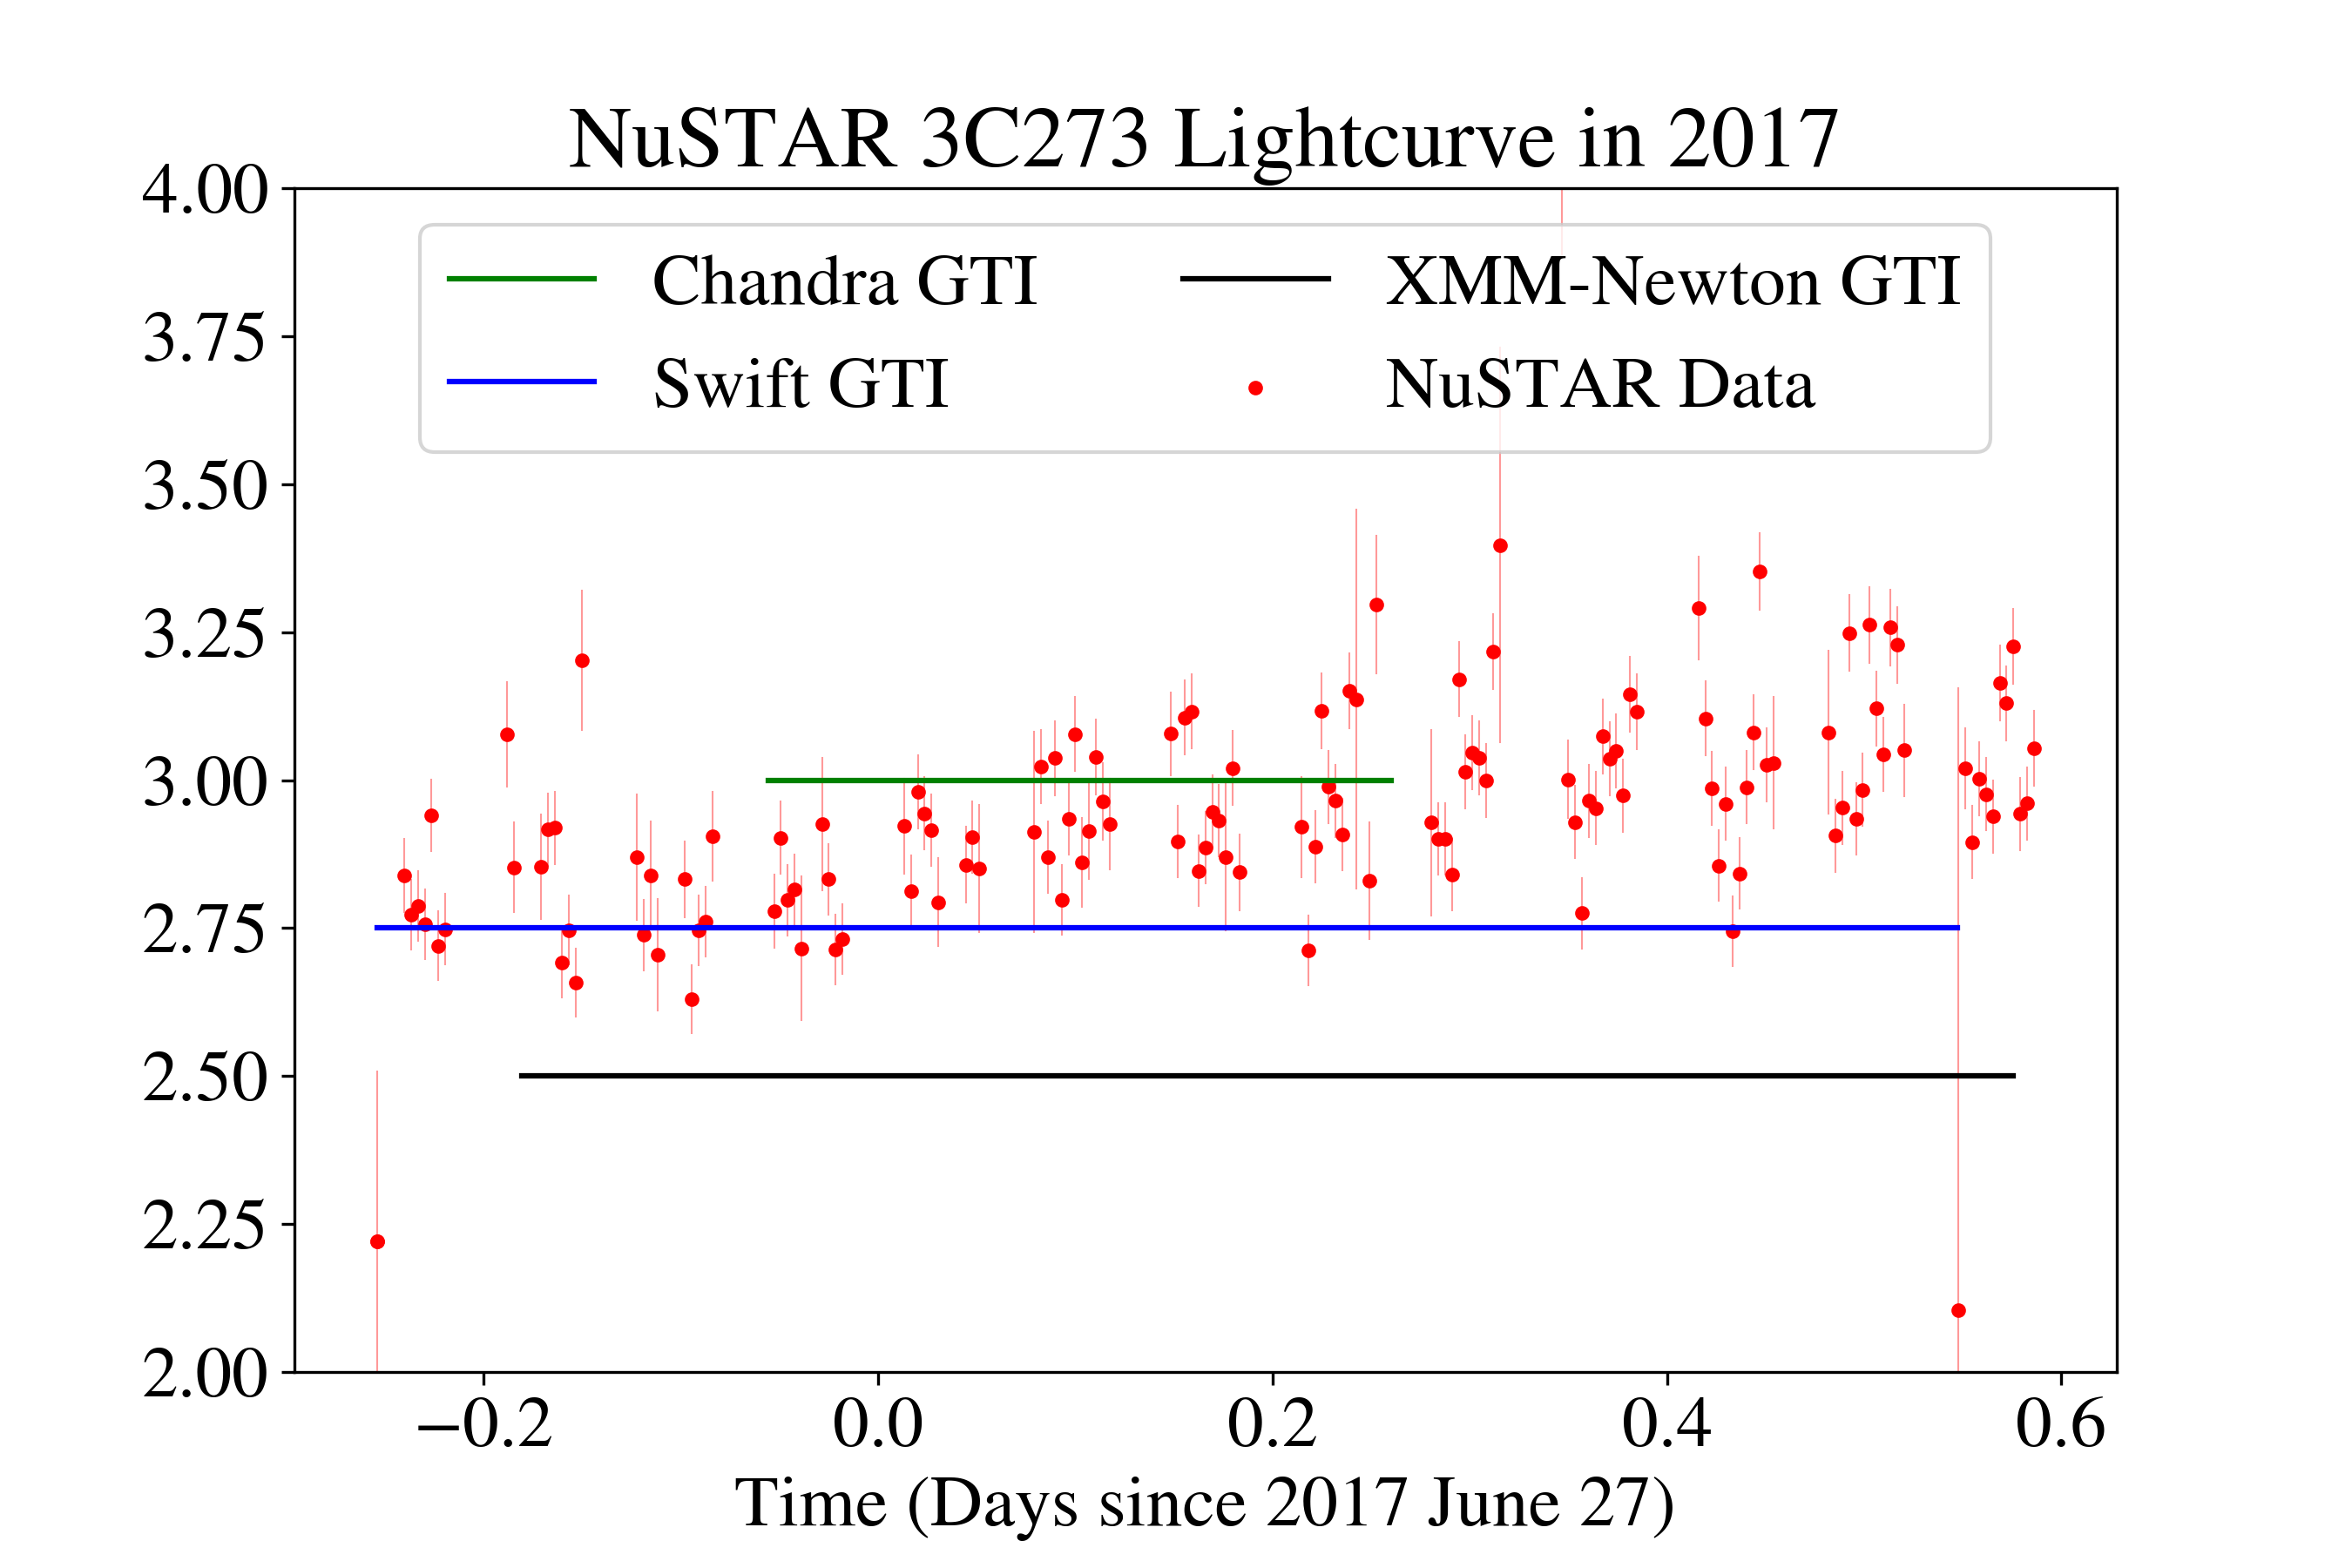
The 2017 NuSTAR lightcurve plotted in Python (y-axis is counts/sec).
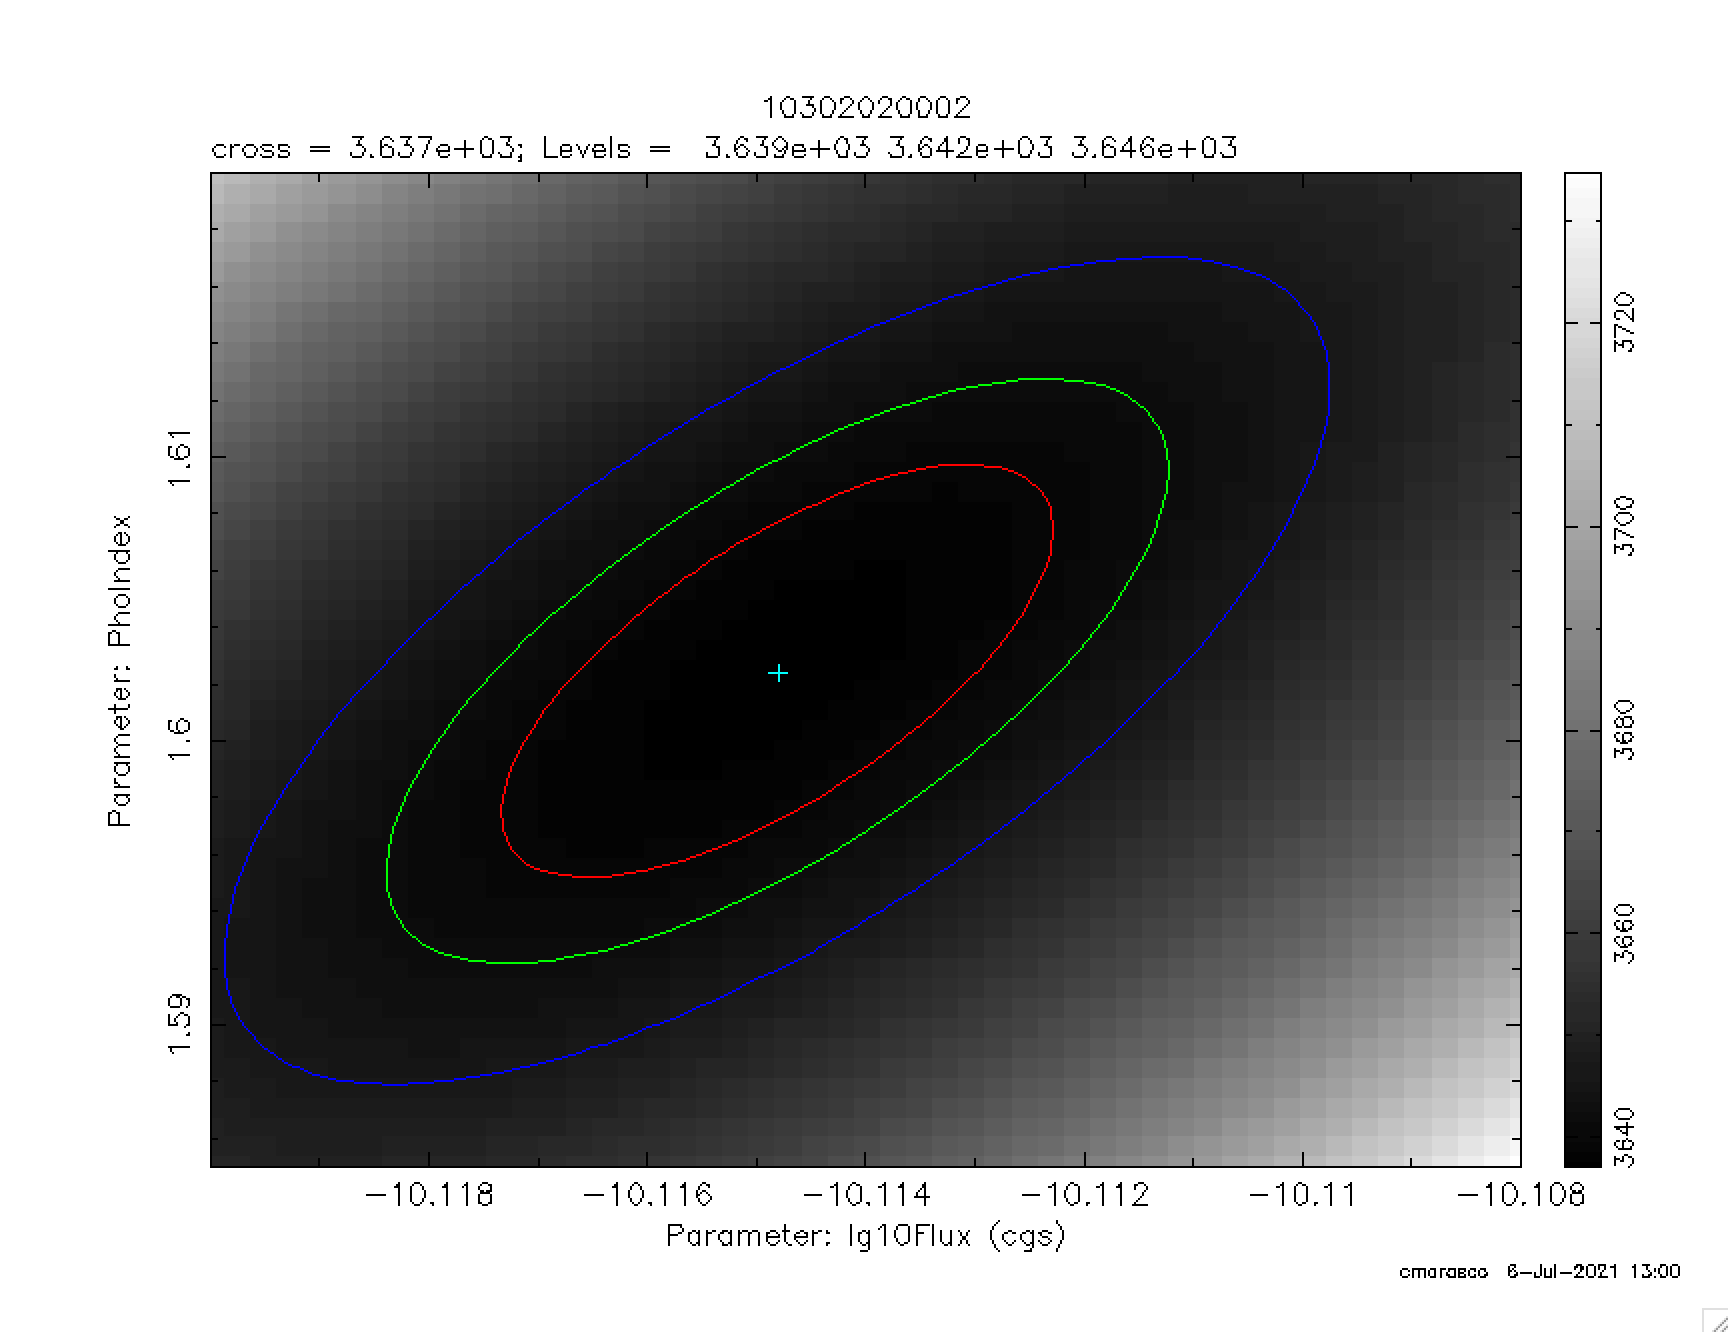
A contour plot for the 2017 NuSTAR data.
I spent most of this week experimenting more with XSPEC and NuSTAR data analysis, so I don’t have as many new plots, but next week, we should finish the NuSTAR plots and analysis and be ready to compare it with the other telescopes!