Week 5
We were still waiting on the extracted telescope data from Swift, Chandra, and XMM-Newton to come in this week, so it’s
been a little slower than usual. I spent most of the week improving my Python code so that it could more accurately
recreate the contour plot data from XSPEC. I also began downloading and installing CIAO, which would let me extract
Chandra data, in case we didn’t receive that extracted data by Friday.
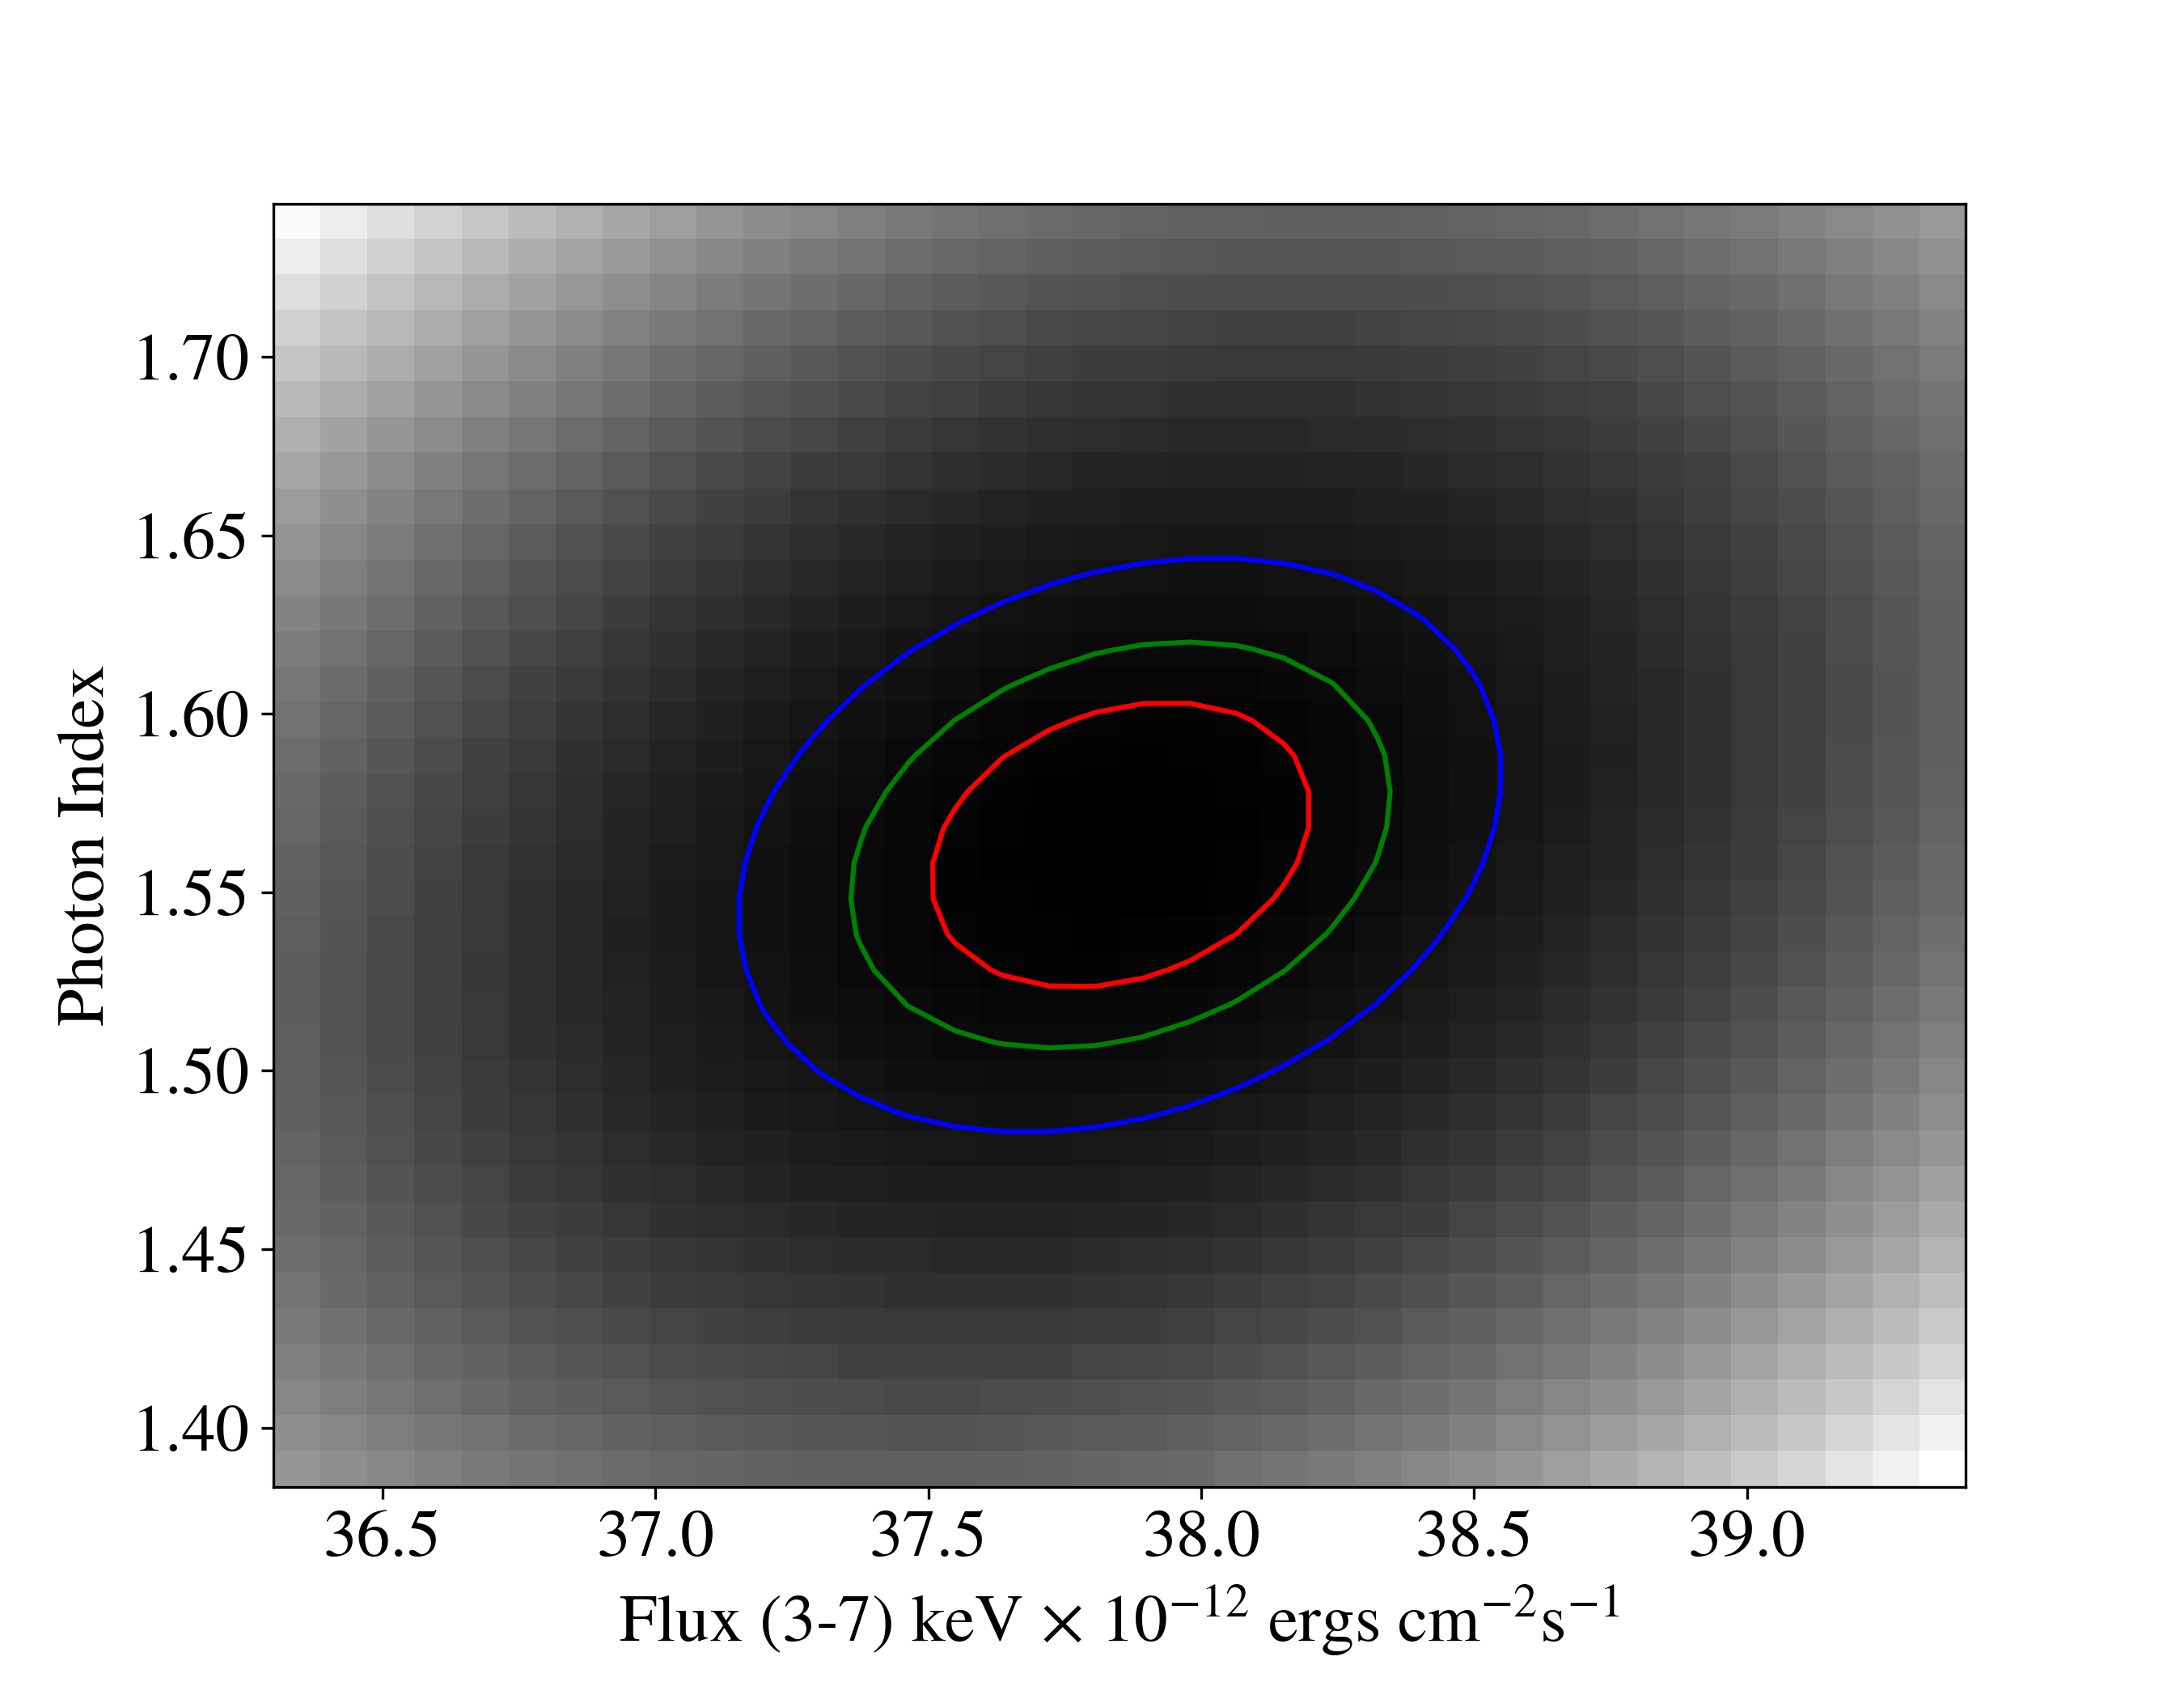
A contour plot recreated in Python
I also wrote a Python function to recreate the last plot needed for our analysis. My mentor sent me a function she had written in IDL for me to recreate in Python. It shows the ratio of the flux of the instruments to the flux of the model created by XSPEC as a function of energy. Once we have data from other telescopes to compare to, this plot can demonstrate how the cross-normalization constant changes at different energy bands.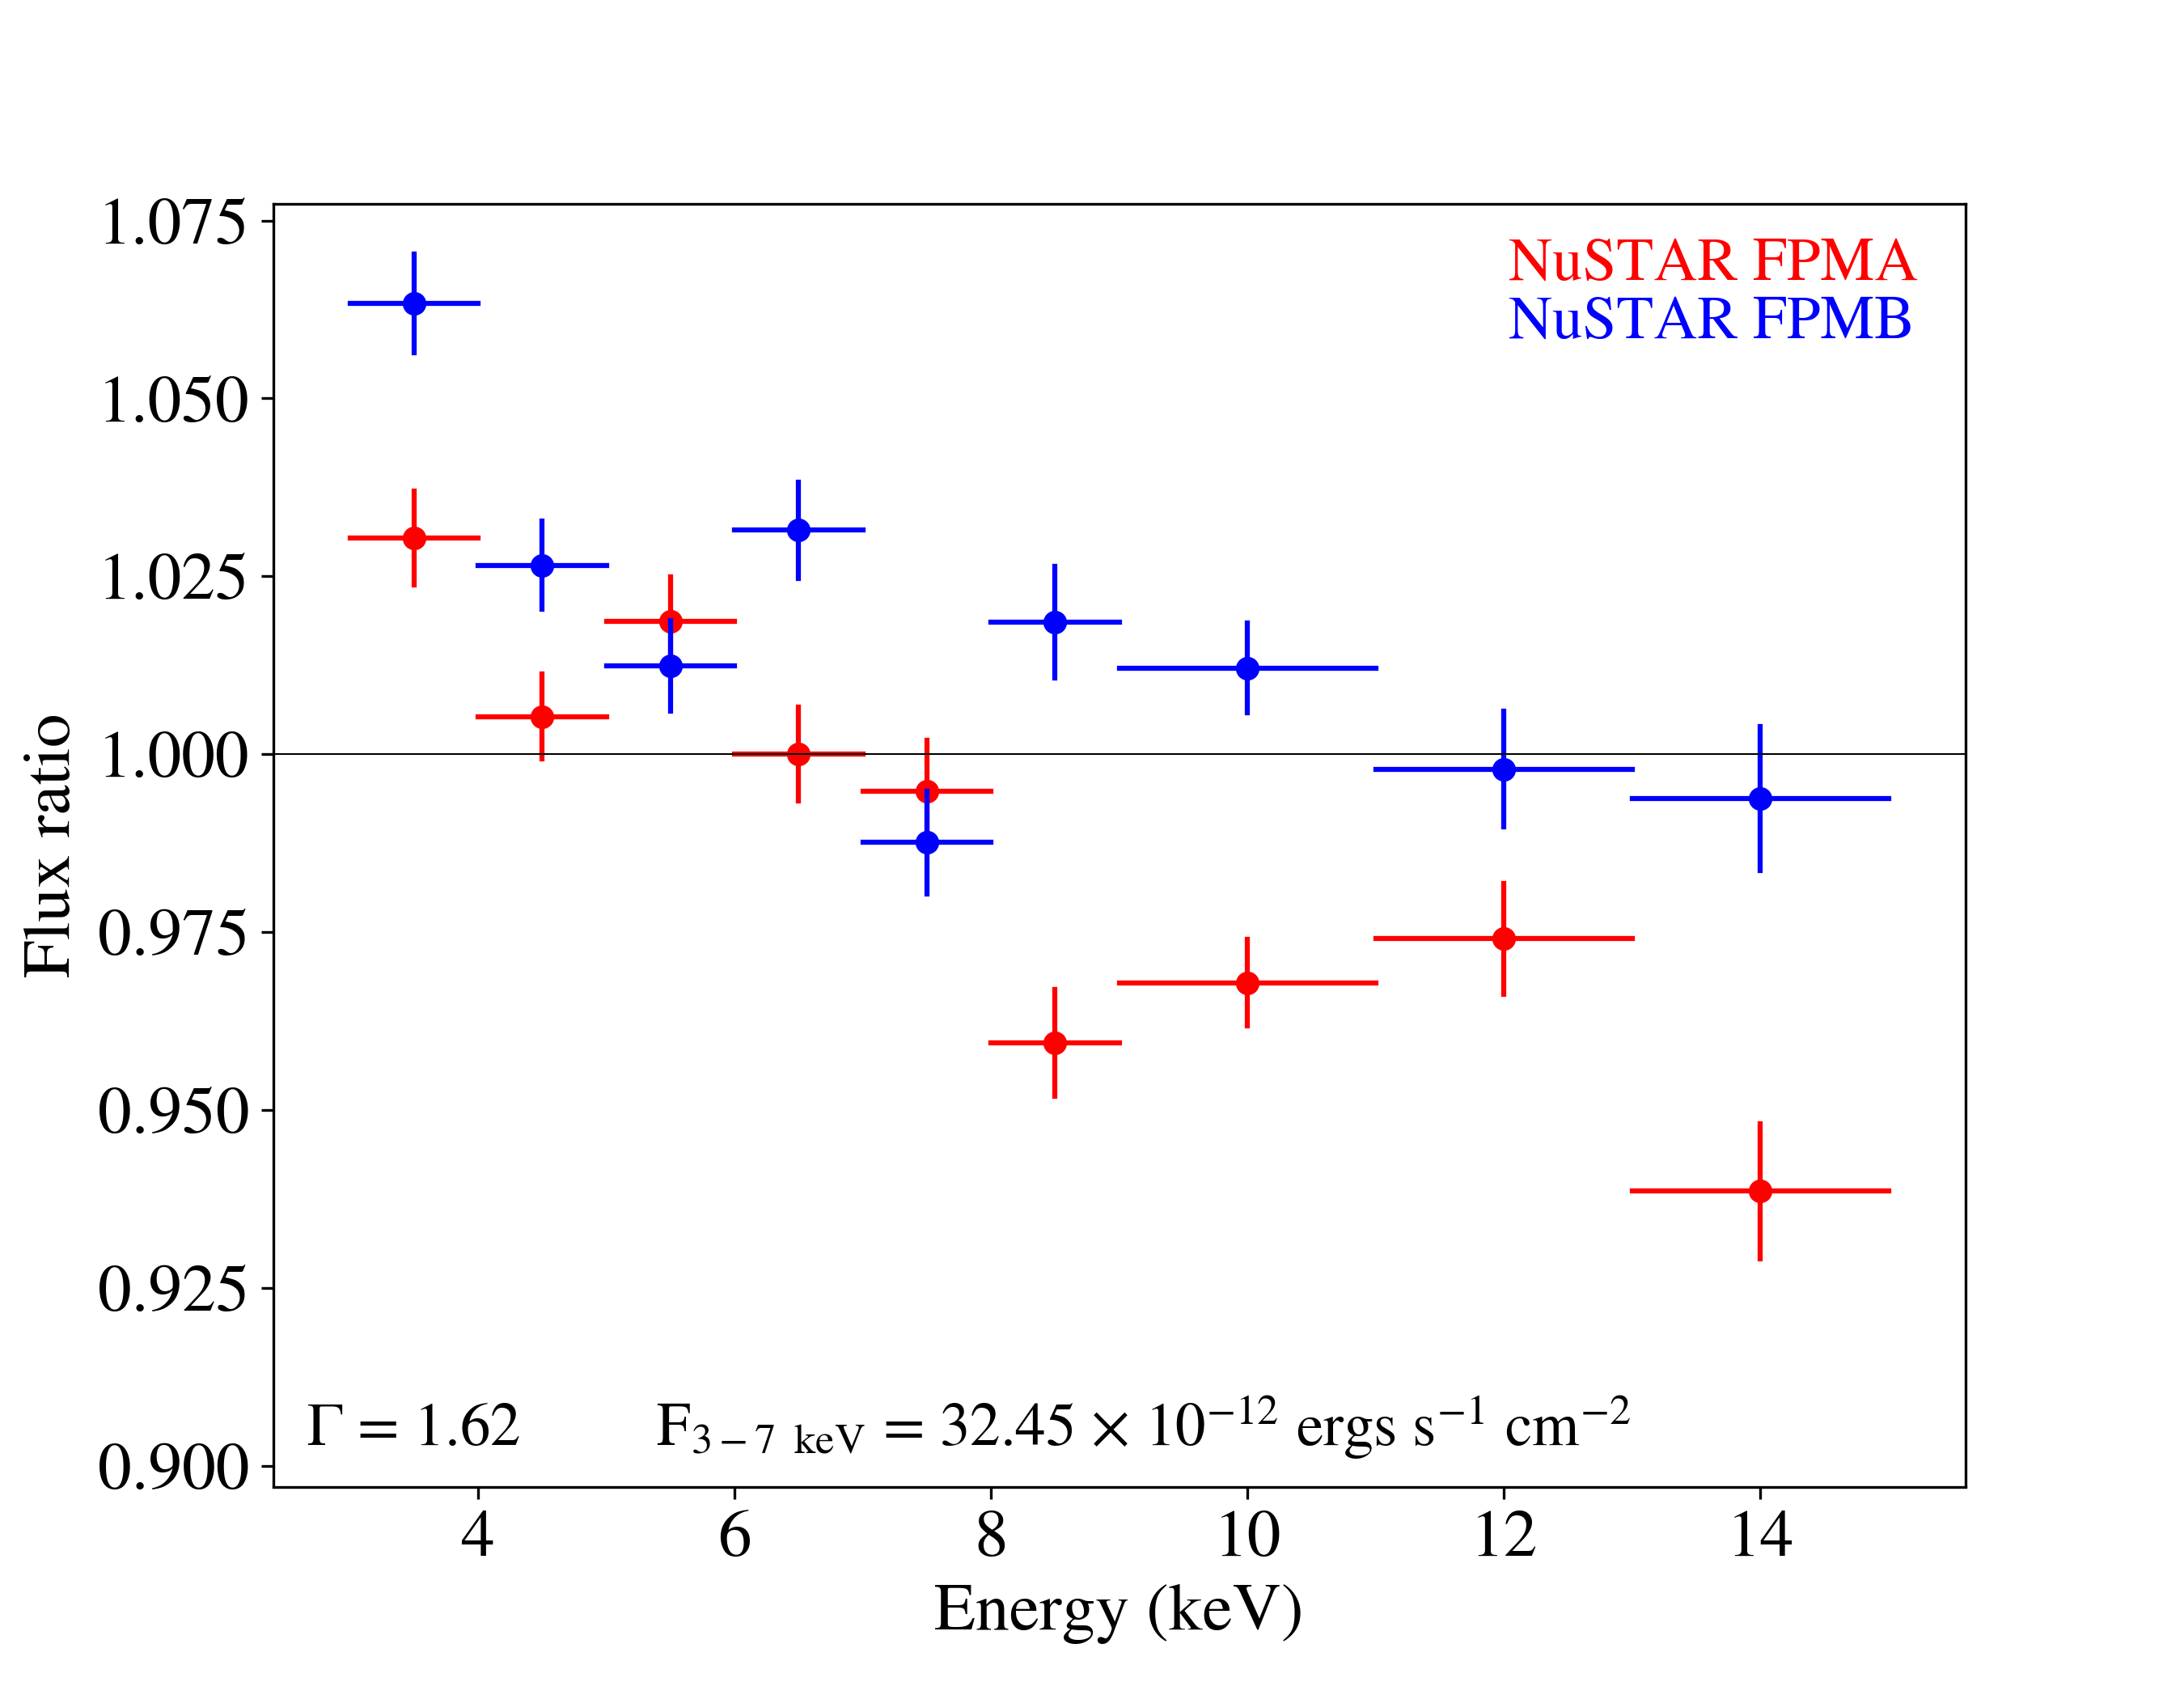
The flux ratio plot for the 2018 NuSTAR data
Lastly, this week, I met one-on-one with a NASA scientist to talk about graduate school. I set up a meeting with her after interacting with her at a few different events, and I really enjoyed speaking with her privately. I learned so much about stellar astronomy, what it’s like to have a career in astronomy, and, of course, graduate school! She was incredibly nice, and it was amazing to hear more about similar research to what I hope to work on in the future!On a sadder note, we didn’t get the extracted data this week, so that’s what I’ll be working on next week! Stay tuned...