Week 3
Now that my computer is set up, I was able to start collecting data for the cross-calibration analysis this week!
Each year, all four X-ray telescopes that we will be cross-calibrating observe 3C 273 on the same day. For our comparisons,
we needed to collect those yearly observations of 3C 273 from each of the four telescopes from the years 2015-2020.
I found and downloaded all necessary files to analyze each observation and organized them into a readable directory
tree.
Each observation has a file with a .fits extension detailing good time intervals, or GTIs, which are times during the
observation when usable information was collected. For our analysis, we need to find when the GTIs for each telescope
overlap so that we can compare data taken simultaneously. To visualize this, I created plots for each year showing
the GTIs of the four observations we will compare!
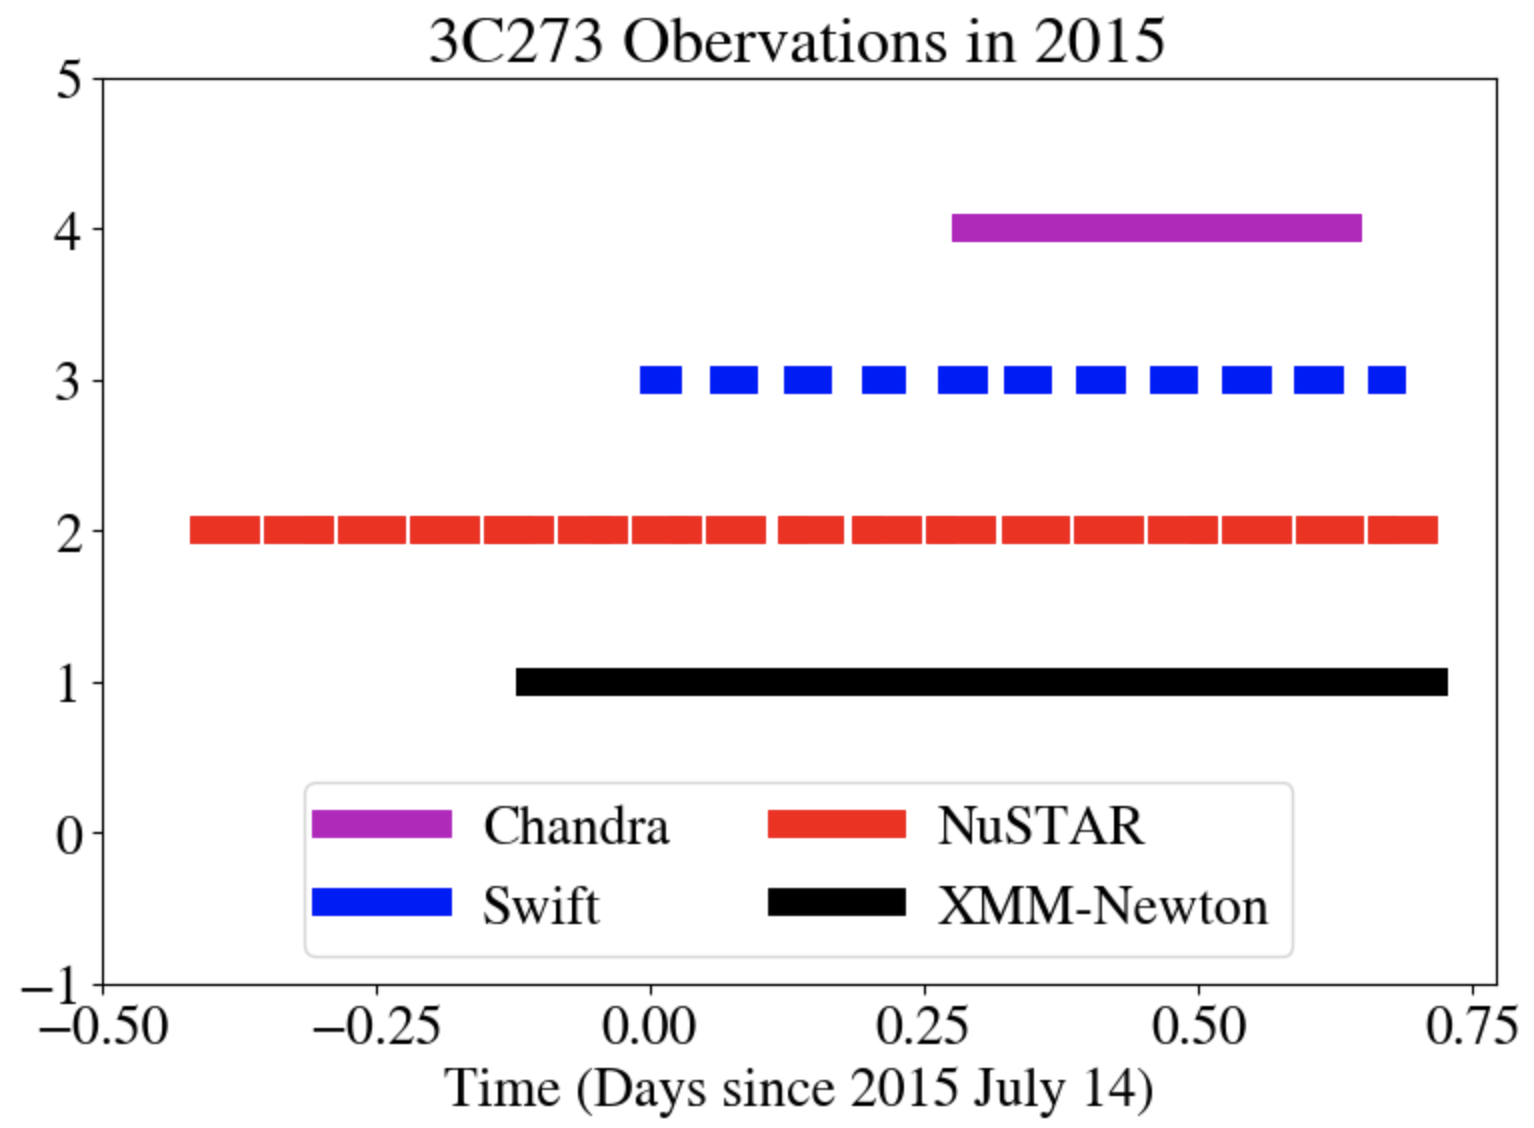
GTIs in 2015 for each of the four telescopes used in the cross-calibration analysis.
Lastly, I had to create my own .fits files containing the start and stop times of the GTI overlaps, so that they could be inputted into a program for further analysis. Because all four GTIs don’t overlap for very long, we only compare two telescopes at a time. Therefore, I needed to create a .fits file containing the start and stop times for the overlap between the NuSTAR and Swift GTIs, then the NuSTAR and Chandra GTIs, then the NuSTAR and XMM-Newton GTIs, and so on for each year. This and the GTI plots were done using Python and the Astropy package.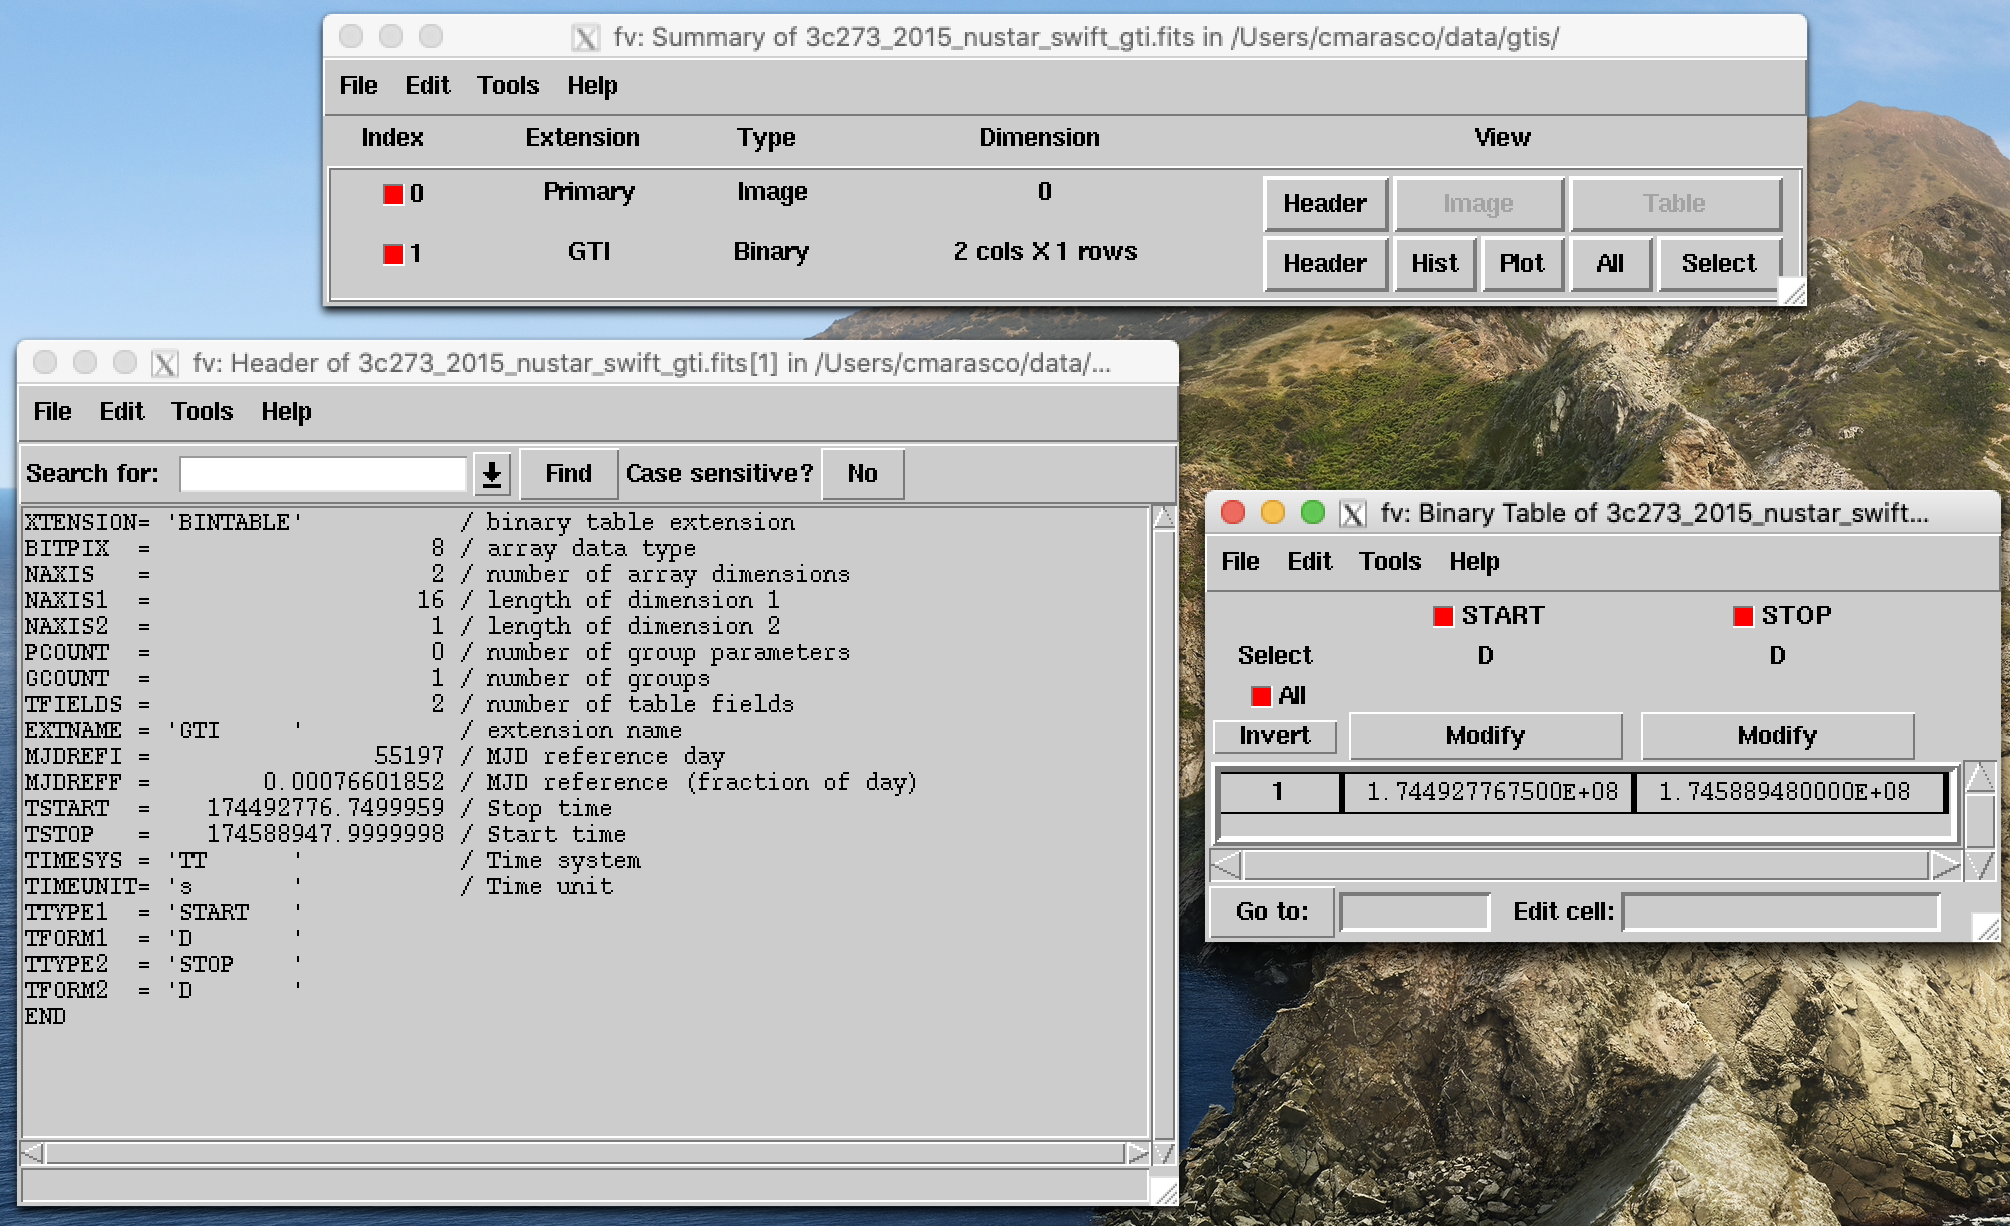
Example of a .fits file showing the start and stop times of the overlap between the NuSTAR and Swift observations in 2015. Start and stop times are given in NuSTAR time, which is seconds since Jan. 1st 2010 at 00:00.
I loved getting to do so much coding in Python this week and learning more about Astropy! I’m really excited to continue programming and creating more figures throughout the summer!