Current Research
Asteroseismology of Red Giants from TESS

I have worked with Dr. Jamie Tayar to calculate the masses and ages of low-metallicity red giants that were observed using the TESS telescope. Those characteristics were found using a technique called asteroseismology.
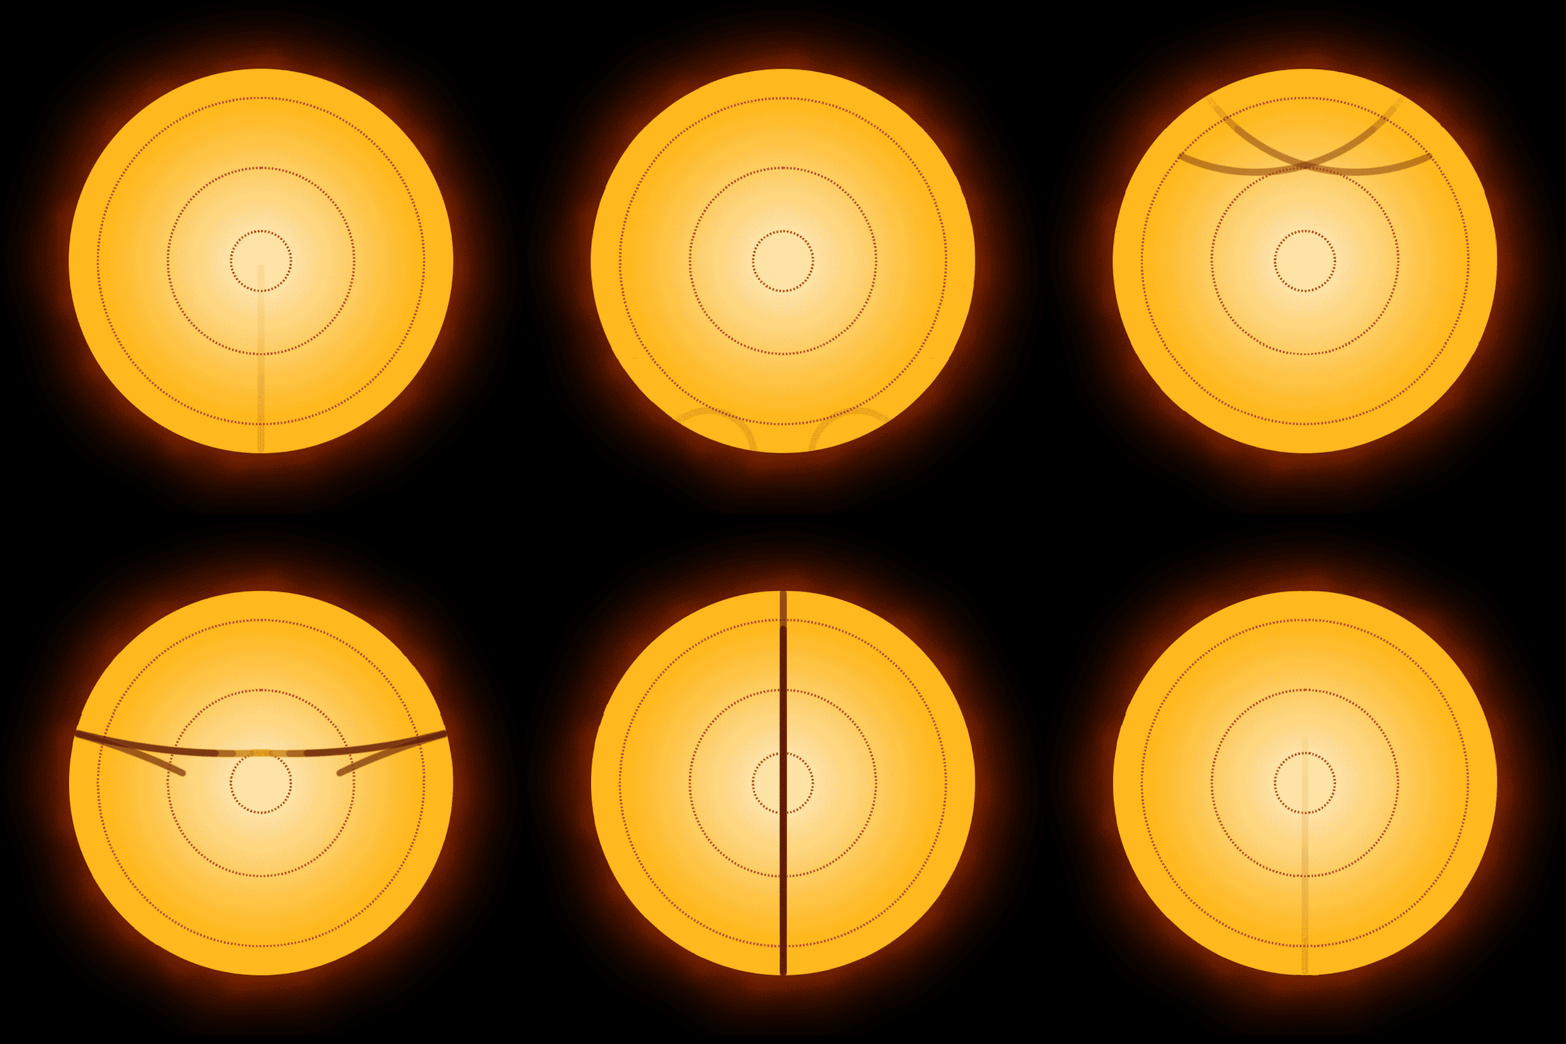
Asteroseismology studies "starquakes" through observations of stellar oscillations over long periods of time. These oscillations represent sound waves that are travelling throughout the star, so they can give us insight into their internal structure. This allows us to determine more precise masses and ages for them.
Because Kepler observes such a narrow part of the sky, using TESS data instead allows us to study larger regions of the galaxy, which is more beneficial for both galactic and exoplanet astronomy research. This is the first in-depth asteroseismic study of a large set of TESS stars.
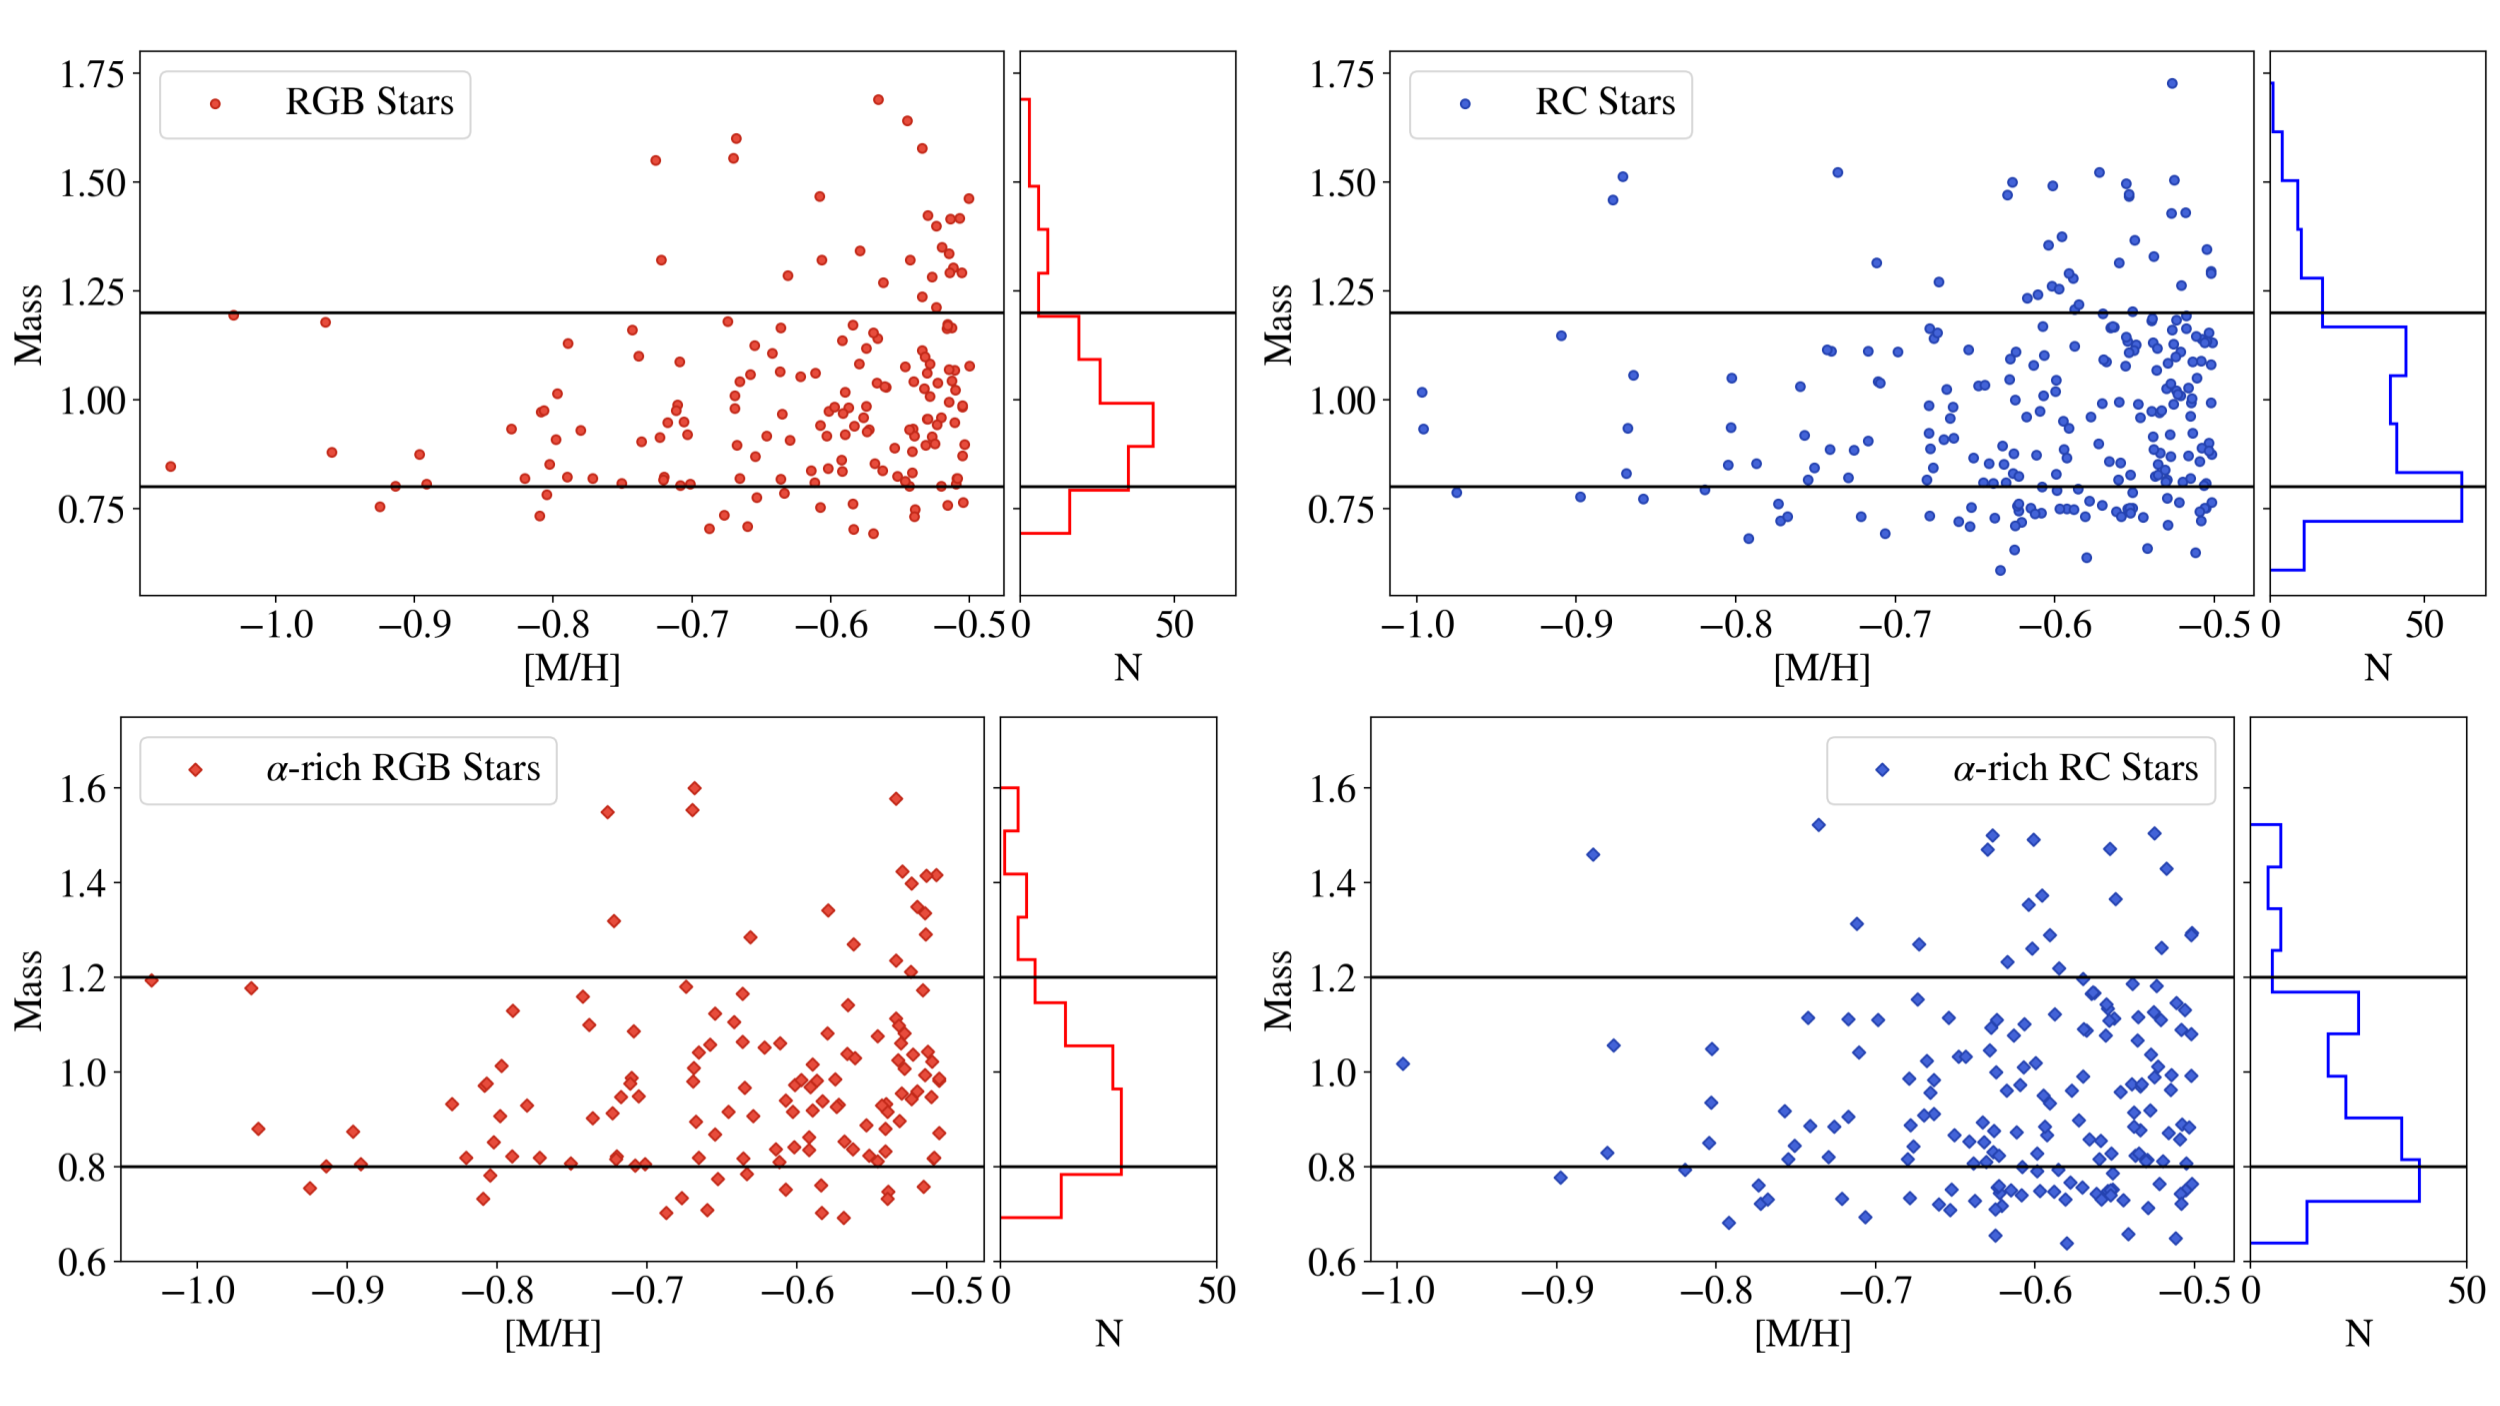
The calculated masses of these metal-poor stars are presented below. A paper on this topic is currently being written for publication.

Past Research
Yellow Supergiants

From 2020-2022, I studied F and G yellow supergiants at Georgia Tech under Dr. James Sowell. I used the properties of the supergiants as presented in the Michigan Spectral Catalogue, and calculated their characteristics and determined trends in the stars.
Yellow supergiants are a rare type of star, in a special stage of stellar evolution, so studying them helps us to better understand stars as they go through a unique phase in their evolution. I compared my results with the literature to find inconsistensies among observations and select specific supergiants that would be interesting to study further, which could help to understand late stellar evolution. A paper will be published about this research in the next few years.
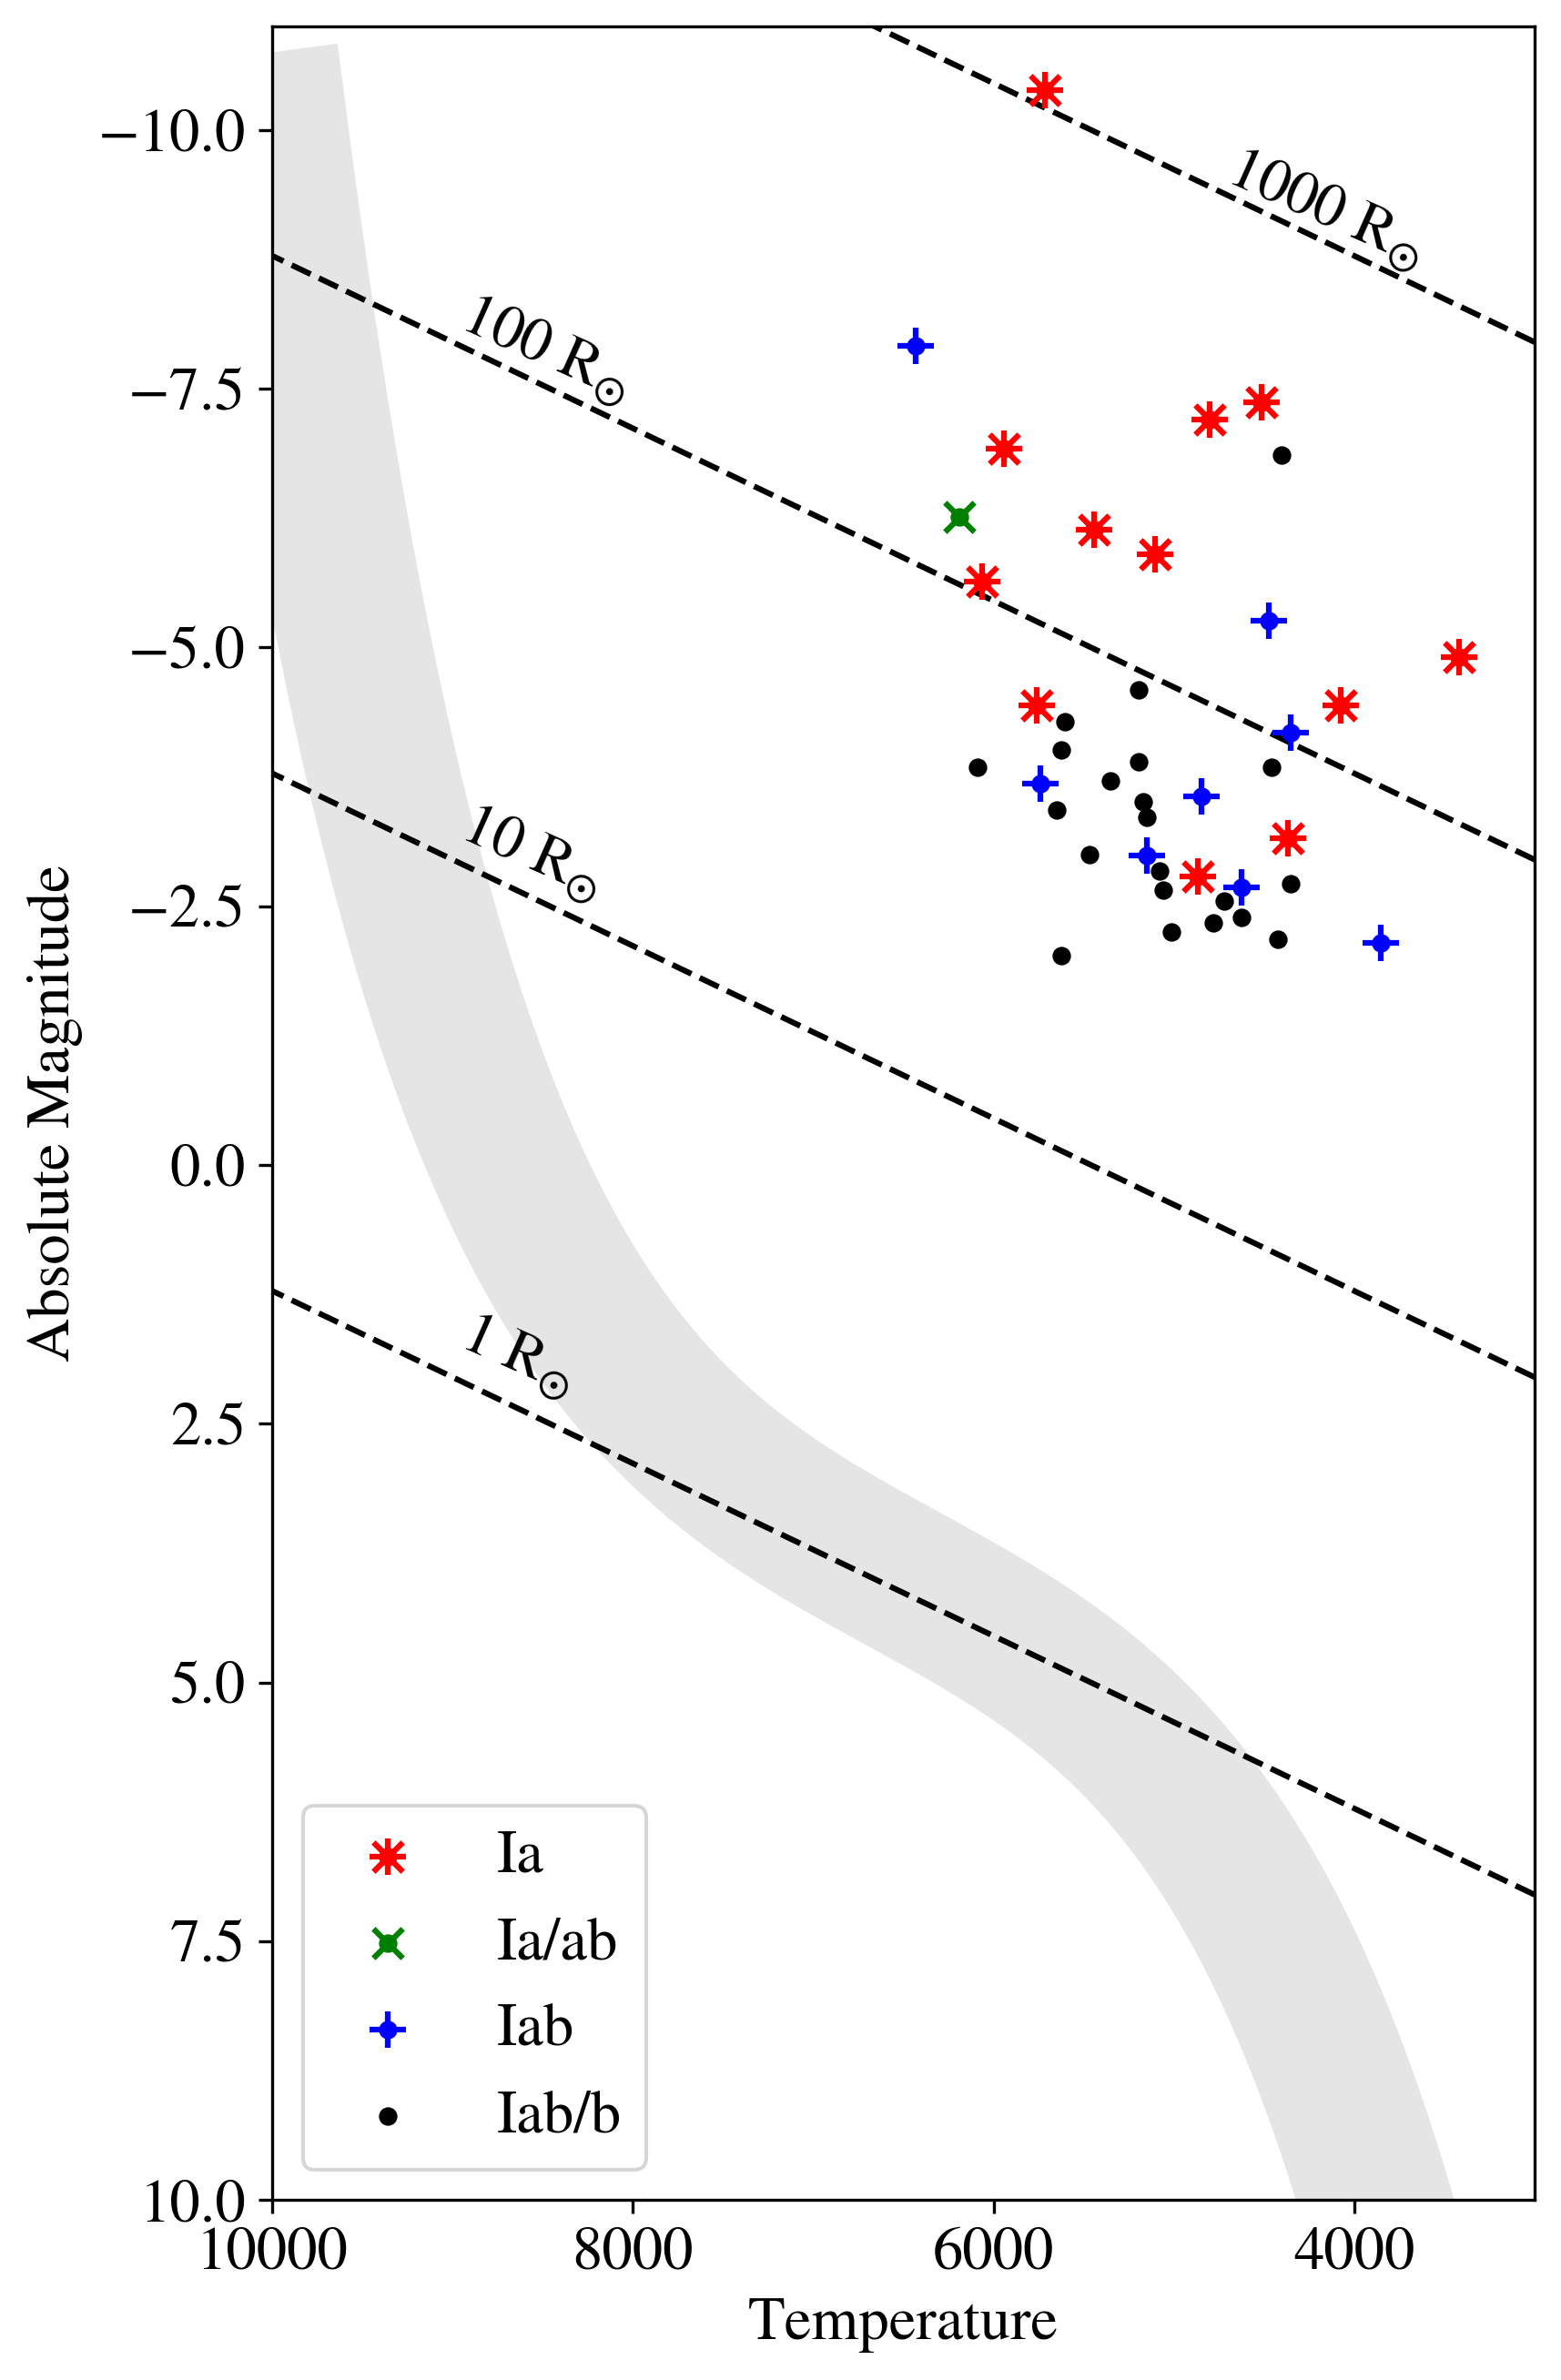
The figure to the right shows the HR diagram (with the main sequence in grey) with the yellow supergiants plotted.
Cross-Calibration of X-ray telescopes
In the summer of 2021, I worked with NASA Goddard (Code 662) and the organization CRESST II to cross-calibrate the X-ray satellites NuSTAR, XMM-Newton, Swift, and Chandra with Dr. Kristin Madsen. We did this using yearly observations of the famous quasar 3C 273 from 2015-2021. I extracted X-ray spectral data for the NuSTAR, Swift, and Chandra observations and fit models to the spectral data from all four telescopes to find flux and photon index values for 3C 273. Using that data, I was able to calculate cross-calibration constants for each observatory pair.
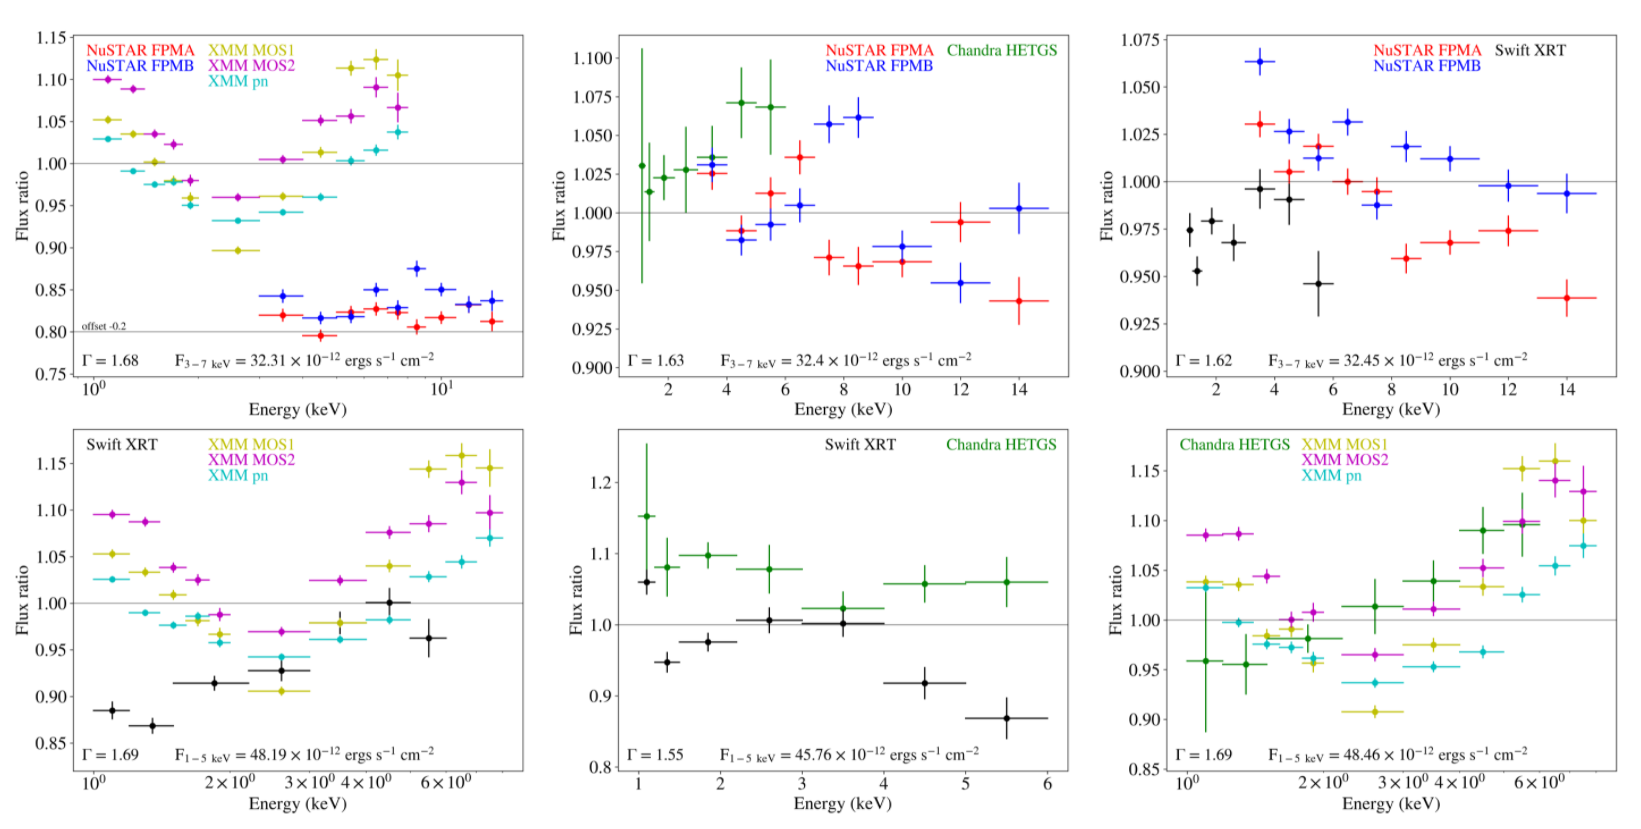
The plots below show the flux ratios (the ratio of the measured flux to our model flux when an observatory pair is fitted together) for each observatory pair. These give us an idea of how good our fit was; ideally, this ratio would be one at all energy levels for all instruments.

The flux ratios were used to derive cross-calibration constants using the average across all six years of data. These calculated constants are shown in the table below.
